Estimated Value: $185,000 - $206,895
3
Beds
2
Baths
1,386
Sq Ft
$142/Sq Ft
Est. Value
About This Home
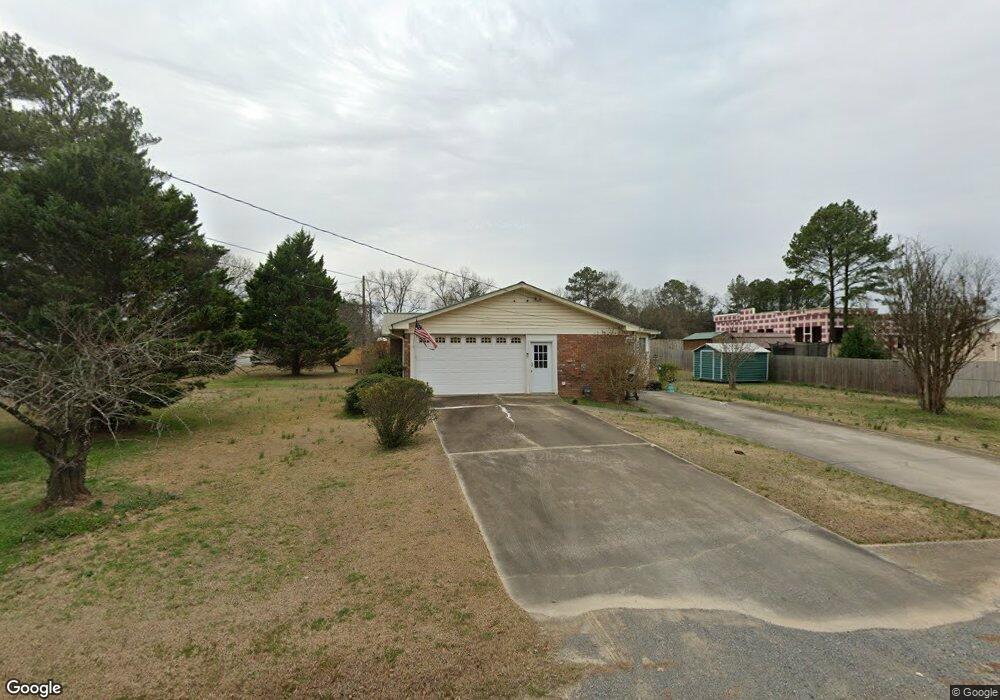
This home is located at 3 Lake Park Dr NW, Rome, GA 30165 and is currently estimated at $196,974, approximately $142 per square foot. 3 Lake Park Dr NW is a home located in Floyd County with nearby schools including Coosa Middle School and Coosa High School.
Ownership History
Date
Name
Owned For
Owner Type
Purchase Details
Closed on
Sep 29, 2010
Sold by
Secretary Of Housing
Bought by
Brownlow Teresa C
Current Estimated Value
Purchase Details
Closed on
May 4, 2010
Sold by
Watson Mitch
Bought by
Bac Home Loans Servicing Lp
Purchase Details
Closed on
Mar 7, 2002
Sold by
Boswell David E
Bought by
Watson Mitch and Maria Watson
Purchase Details
Closed on
Oct 9, 2001
Sold by
Boswell Dan D and Boswell Shelor H
Bought by
Boswell David E
Purchase Details
Closed on
Nov 1, 1996
Sold by
Marie Brookshire O and Marie L
Bought by
Boswell Dan D and Boswell Shelor H
Purchase Details
Closed on
Jul 30, 1987
Sold by
Brandin Jackson Terry
Bought by
Marie Brookshire O and Marie L
Purchase Details
Closed on
Jun 25, 1976
Sold by
Brandin Clifford and Brandin Mary G
Bought by
Brandin Jackson Terry
Purchase Details
Closed on
Jun 20, 1968
Sold by
Smith Britten Brine Inc
Bought by
Brandin Clifford and Brandin Mary G
Purchase Details
Closed on
Jan 1, 1901
Bought by
Smith Britten Brine Inc
Create a Home Valuation Report for This Property
The Home Valuation Report is an in-depth analysis detailing your home's value as well as a comparison with similar homes in the area
Home Values in the Area
Average Home Value in this Area
Purchase History
| Date | Buyer | Sale Price | Title Company |
|---|---|---|---|
| Brownlow Teresa C | $60,000 | -- | |
| Bac Home Loans Servicing Lp | $119,348 | -- | |
| Watson Mitch | $103,000 | -- | |
| Boswell David E | $59,400 | -- | |
| Boswell Dan D | $68,000 | -- | |
| Marie Brookshire O | -- | -- | |
| Brandin Jackson Terry | -- | -- | |
| Brandin Clifford | $18,500 | -- | |
| Smith Britten Brine Inc | -- | -- |
Source: Public Records
Tax History Compared to Growth
Tax History
| Year | Tax Paid | Tax Assessment Tax Assessment Total Assessment is a certain percentage of the fair market value that is determined by local assessors to be the total taxable value of land and additions on the property. | Land | Improvement |
|---|---|---|---|---|
| 2024 | $480 | $59,456 | $8,424 | $51,032 |
| 2023 | $742 | $56,616 | $7,488 | $49,128 |
| 2022 | $608 | $47,539 | $6,084 | $41,455 |
| 2021 | $546 | $43,730 | $6,084 | $37,646 |
| 2020 | $480 | $37,573 | $4,680 | $32,893 |
| 2019 | $1,086 | $36,417 | $4,680 | $31,737 |
| 2018 | $1,048 | $35,217 | $4,680 | $30,537 |
| 2017 | $1,034 | $34,673 | $4,680 | $29,993 |
| 2016 | $1,041 | $34,480 | $4,680 | $29,800 |
| 2015 | $1,182 | $35,040 | $4,680 | $30,360 |
| 2014 | $1,182 | $36,681 | $4,680 | $32,001 |
Source: Public Records
Map
Nearby Homes
- 4485 Alabama Hwy
- 10 Nest Dr NW
- 8 Kayla Dr NW
- 48 Atwood Dr NW
- 4813 Alabama Hwy SW
- 1 Ann Dr NW
- 43 Brownlow Dr NW
- 33 Cedar Ln NW
- 31 Cedar Ln NW
- 5 Red Fox Dr SW
- 293 N Avery Rd NW
- 0 Alabama Hwy Unit 10590171
- 0 Alabama Hwy Unit 7635346
- 0 Alabama Hwy Unit 7494552
- 775 Mays Bridge Rd SW
- 45 Albert Ave NW
- 86 N Avery Rd NW
- 26 Red Fox Dr SW
- 87 Northside Dr NW
- 458 Kraftsman Rd SW
- 20 Fairhaven Dr NW
- 2 Lake Park Dr NW
- 23 Fairhaven Dr NW
- 18 Fairhaven Dr NW
- 21 Fairhaven Dr NW
- 4814 Alabama Hwy
- 4 Lake Park Dr NW
- 19 Fairhaven Dr NW
- 26 Fairhaven Dr NW
- 16 Fairhaven Dr NW
- 7 Lake Park Dr NW
- 27 Fairhaven Dr NW
- 11 Lake Park Dr NW
- 14A Fairhaven Dr NW Unit B
- 17 Fairhaven Dr NW
- 6 Lake Park Dr NW
- 4589 Alabama Hwy SW
- 13 Lake Park Dr NW
- 28 Fairhaven Dr NW
- 0 Fairhaven Dr NW Unit 3190512