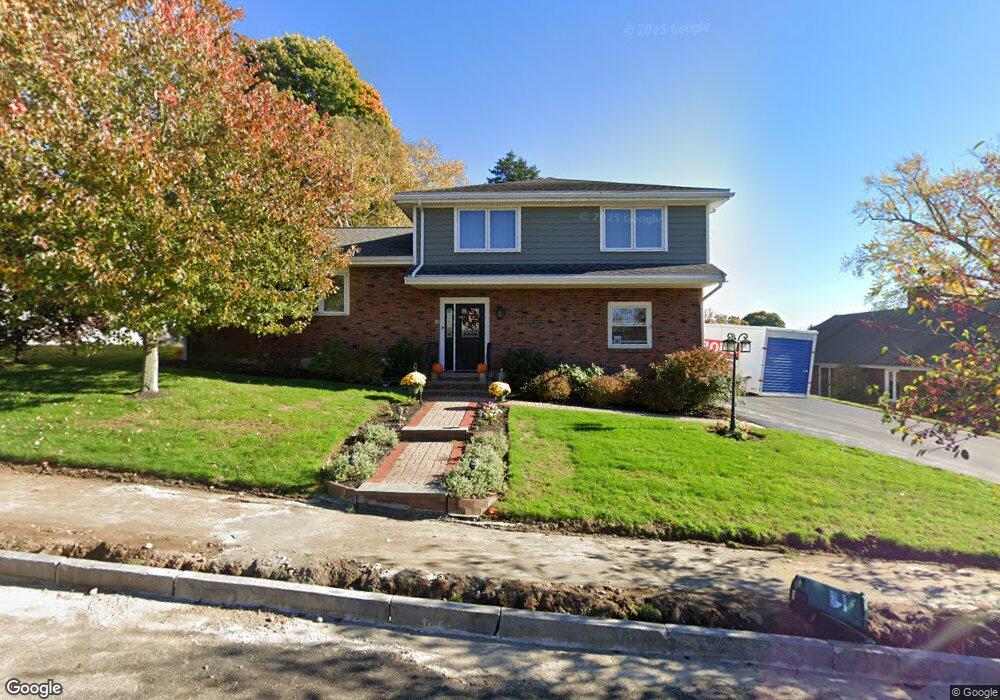
3 Lakeshore Dr Wakefield, MA 01880
Lakeside NeighborhoodEstimated Value: $1,022,111 - $1,300,000
3
Beds
3
Baths
2,654
Sq Ft
$420/Sq Ft
Est. Value
About This Home
This home is located at 3 Lakeshore Dr, Wakefield, MA 01880 and is currently estimated at $1,115,278, approximately $420 per square foot. 3 Lakeshore Dr is a home located in Middlesex County with nearby schools including Wakefield Memorial High School and St Joseph School.
Ownership History
Date
Name
Owned For
Owner Type
Purchase Details
Closed on
Nov 16, 2006
Sold by
Bandino John P and Bandino Mary Ellen
Bought by
Dalton Theodore J and Dalton Jennifer
Current Estimated Value
Home Financials for this Owner
Home Financials are based on the most recent Mortgage that was taken out on this home.
Original Mortgage
$590,000
Outstanding Balance
$351,339
Interest Rate
6.33%
Mortgage Type
Purchase Money Mortgage
Estimated Equity
$763,939
Purchase Details
Closed on
May 10, 2005
Sold by
Bandino Mary Ellen
Bought by
Bandino John P and Bandino Mary Ellen
Create a Home Valuation Report for This Property
The Home Valuation Report is an in-depth analysis detailing your home's value as well as a comparison with similar homes in the area
Home Values in the Area
Average Home Value in this Area
Purchase History
| Date | Buyer | Sale Price | Title Company |
|---|---|---|---|
| Dalton Theodore J | $590,000 | -- | |
| Bandino John P | -- | -- |
Source: Public Records
Mortgage History
| Date | Status | Borrower | Loan Amount |
|---|---|---|---|
| Open | Dalton Theodore J | $590,000 |
Source: Public Records
Tax History Compared to Growth
Tax History
| Year | Tax Paid | Tax Assessment Tax Assessment Total Assessment is a certain percentage of the fair market value that is determined by local assessors to be the total taxable value of land and additions on the property. | Land | Improvement |
|---|---|---|---|---|
| 2025 | $10,557 | $930,100 | $371,100 | $559,000 |
| 2024 | $10,159 | $903,000 | $360,300 | $542,700 |
| 2023 | $9,485 | $808,600 | $336,200 | $472,400 |
| 2022 | $8,896 | $722,100 | $300,200 | $421,900 |
| 2021 | $7,952 | $624,700 | $273,800 | $350,900 |
| 2020 | $7,838 | $613,800 | $269,000 | $344,800 |
| 2019 | $7,559 | $589,200 | $258,200 | $331,000 |
| 2018 | $7,382 | $570,000 | $249,800 | $320,200 |
| 2017 | $7,140 | $548,000 | $240,200 | $307,800 |
| 2016 | $7,277 | $539,400 | $233,500 | $305,900 |
| 2015 | $6,867 | $509,400 | $220,500 | $288,900 |
| 2014 | $6,382 | $499,400 | $216,200 | $283,200 |
Source: Public Records
Map
Nearby Homes
- 270 Lowell St
- 29 Cordis St
- 48 Cordis St
- 50 Quannapowitt Pkwy
- 22 Wayland Rd
- 1 Mansfield Dr
- 10 Wolcott St
- 73 Track Rd
- 18 Paon Blvd
- 20 N Emerson St Unit 20
- 24 Park St
- 13 Highland St
- 7 Carnation Cir Unit C
- 9 Avon St Unit 2
- 26 Curve St
- 4 Mcdonald Farm Rd
- 47 Emerson St
- 16 Pleasant St
- 114 Parker Rd
- 6 Avon Ct Unit 2