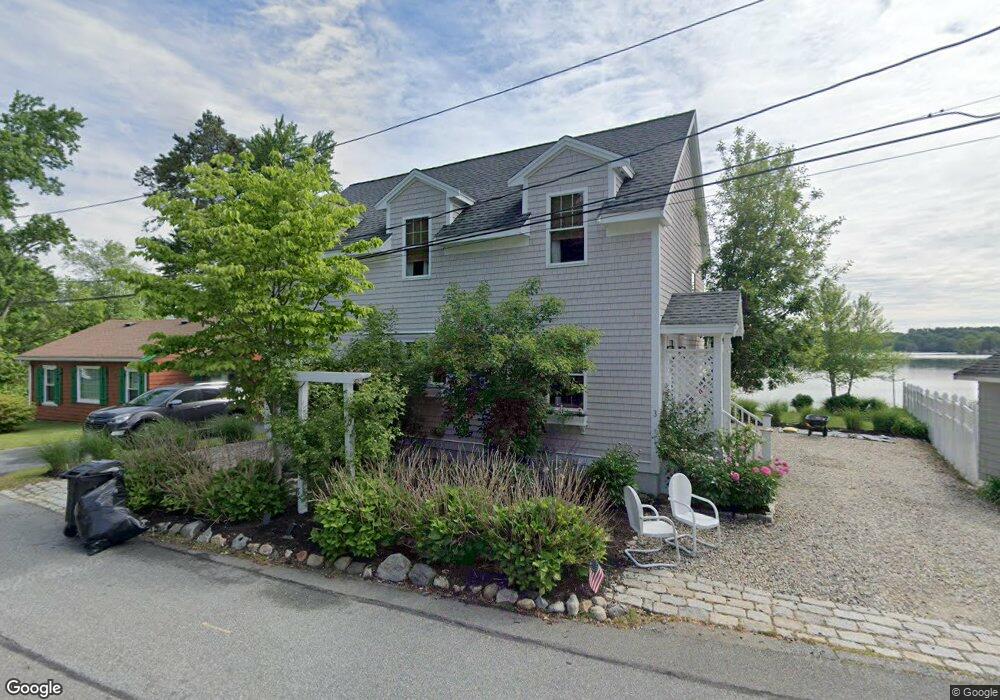
3 Lakeview Ave Lynnfield, MA 01940
Estimated Value: $986,211 - $1,120,000
1
Bed
3
Baths
2,382
Sq Ft
$444/Sq Ft
Est. Value
About This Home
This home is located at 3 Lakeview Ave, Lynnfield, MA 01940 and is currently estimated at $1,056,803, approximately $443 per square foot. 3 Lakeview Ave is a home located in Essex County with nearby schools including Pickering Middle School, Lynnfield High School, and Our Lady Of Assumption School.
Ownership History
Date
Name
Owned For
Owner Type
Purchase Details
Closed on
Aug 10, 2009
Sold by
Livermore Franklin T
Bought by
Roberts Brian D
Current Estimated Value
Purchase Details
Closed on
Sep 7, 2005
Sold by
Livermore Frank T
Bought by
Ingianni Mario
Create a Home Valuation Report for This Property
The Home Valuation Report is an in-depth analysis detailing your home's value as well as a comparison with similar homes in the area
Home Values in the Area
Average Home Value in this Area
Purchase History
| Date | Buyer | Sale Price | Title Company |
|---|---|---|---|
| Roberts Brian D | $231,000 | -- | |
| Ingianni Mario | $250,000 | -- |
Source: Public Records
Mortgage History
| Date | Status | Borrower | Loan Amount |
|---|---|---|---|
| Open | Ingianni Mario | $120,000 | |
| Open | Ingianni Mario | $335,500 | |
| Closed | Ingianni Mario | $328,000 |
Source: Public Records
Tax History Compared to Growth
Tax History
| Year | Tax Paid | Tax Assessment Tax Assessment Total Assessment is a certain percentage of the fair market value that is determined by local assessors to be the total taxable value of land and additions on the property. | Land | Improvement |
|---|---|---|---|---|
| 2025 | $9,474 | $897,200 | $527,100 | $370,100 |
| 2024 | $8,367 | $796,100 | $466,500 | $329,600 |
| 2023 | $8,370 | $740,700 | $442,500 | $298,200 |
| 2022 | $8,193 | $683,300 | $442,500 | $240,800 |
| 2021 | $8,111 | $611,200 | $379,800 | $231,400 |
| 2020 | $7,812 | $561,200 | $328,200 | $233,000 |
| 2019 | $7,600 | $546,400 | $313,400 | $233,000 |
| 2018 | $7,518 | $546,400 | $313,400 | $233,000 |
| 2017 | $7,529 | $546,400 | $313,400 | $233,000 |
| 2016 | $7,508 | $517,800 | $280,200 | $237,600 |
| 2015 | $7,503 | $517,800 | $280,200 | $237,600 |
Source: Public Records
Map
Nearby Homes