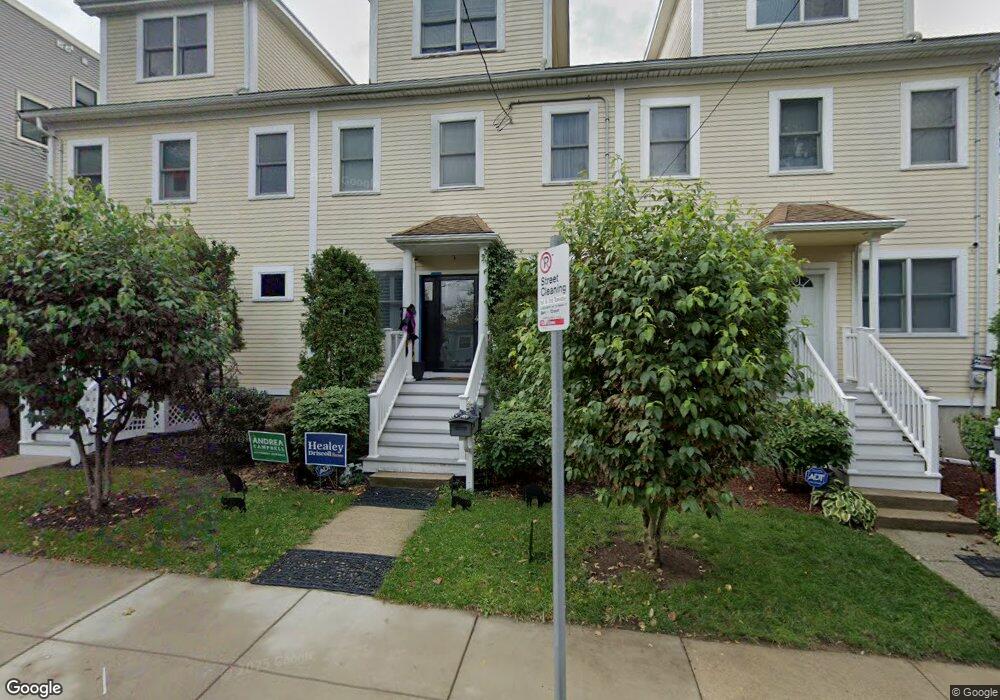
3 Langford Park Roxbury, MA 02119
Sav-Mor NeighborhoodEstimated Value: $673,000 - $768,773
4
Beds
3
Baths
1,963
Sq Ft
$368/Sq Ft
Est. Value
About This Home
This home is located at 3 Langford Park, Roxbury, MA 02119 and is currently estimated at $722,693, approximately $368 per square foot. 3 Langford Park is a home located in Suffolk County with nearby schools including Dudley Street Neighborhood Charter School and City on a Hill Charter Public School.
Ownership History
Date
Name
Owned For
Owner Type
Purchase Details
Closed on
Nov 21, 2005
Sold by
Langford Park Condo 1 &
Bought by
Dunker Otto
Current Estimated Value
Home Financials for this Owner
Home Financials are based on the most recent Mortgage that was taken out on this home.
Original Mortgage
$71,980
Outstanding Balance
$39,511
Interest Rate
6.07%
Mortgage Type
Purchase Money Mortgage
Estimated Equity
$683,182
Create a Home Valuation Report for This Property
The Home Valuation Report is an in-depth analysis detailing your home's value as well as a comparison with similar homes in the area
Home Values in the Area
Average Home Value in this Area
Purchase History
| Date | Buyer | Sale Price | Title Company |
|---|---|---|---|
| Dunker Otto | $359,900 | -- |
Source: Public Records
Mortgage History
| Date | Status | Borrower | Loan Amount |
|---|---|---|---|
| Open | Dunker Otto | $71,980 |
Source: Public Records
Tax History Compared to Growth
Tax History
| Year | Tax Paid | Tax Assessment Tax Assessment Total Assessment is a certain percentage of the fair market value that is determined by local assessors to be the total taxable value of land and additions on the property. | Land | Improvement |
|---|---|---|---|---|
| 2025 | $7,864 | $679,100 | $0 | $679,100 |
| 2024 | $6,406 | $587,700 | $0 | $587,700 |
| 2023 | $6,068 | $565,000 | $0 | $565,000 |
| 2022 | $5,855 | $538,100 | $0 | $538,100 |
| 2021 | $5,628 | $527,500 | $0 | $527,500 |
| 2020 | $5,060 | $479,200 | $0 | $479,200 |
| 2019 | $4,591 | $435,600 | $0 | $435,600 |
| 2018 | $4,149 | $395,900 | $0 | $395,900 |
| 2017 | $3,917 | $369,900 | $0 | $369,900 |
| 2016 | $3,803 | $345,700 | $0 | $345,700 |
| 2015 | $3,260 | $269,200 | $0 | $269,200 |
| 2014 | $3,312 | $263,300 | $0 | $263,300 |
Source: Public Records
Map
Nearby Homes
- 7 Langford Park Unit 3
- 59 Perrin St
- 59 Perrin St Unit 1
- 30 Copeland St Unit 1
- 33 Copeland Park Unit C
- 22 Alaska St
- 31 Alaska St
- 119 Blue Hill Ave
- 133 Blue Hill Ave
- 10 Rockland St Unit 4
- 45 Woodville St
- 80 Blue Hill Ave Unit 5
- Lot 84 Blue Hill Ave
- 62 Clifford St Unit A
- 79 W Cottage St
- 22 Rockville Park
- 20 Rockville Park
- 12 Gayland St
- 101 Mount Pleasant Ave
- 94 Walnut Ave
- 1 Langford Park
- 3 Langford Park Unit 3
- 3 Langford Park Unit 3,3
- 5 Langford Park
- 5 Langford Park Unit 3
- 43 Copeland St
- 45 Copeland St
- 41 Copeland St
- 7 Langford Park
- 7 Langford Park Unit 2
- 33 Copeland St Unit B
- 33 Copeland St Unit F
- 39 Copeland St Unit 3
- 39 Copeland St Unit 2
- 39 Copeland St Unit 1
- 39 Copeland St
- 49 Copeland St Unit 2
- 49 Copeland St
- 49 Copeland St Unit 1
- 49 Copeland St Unit 3