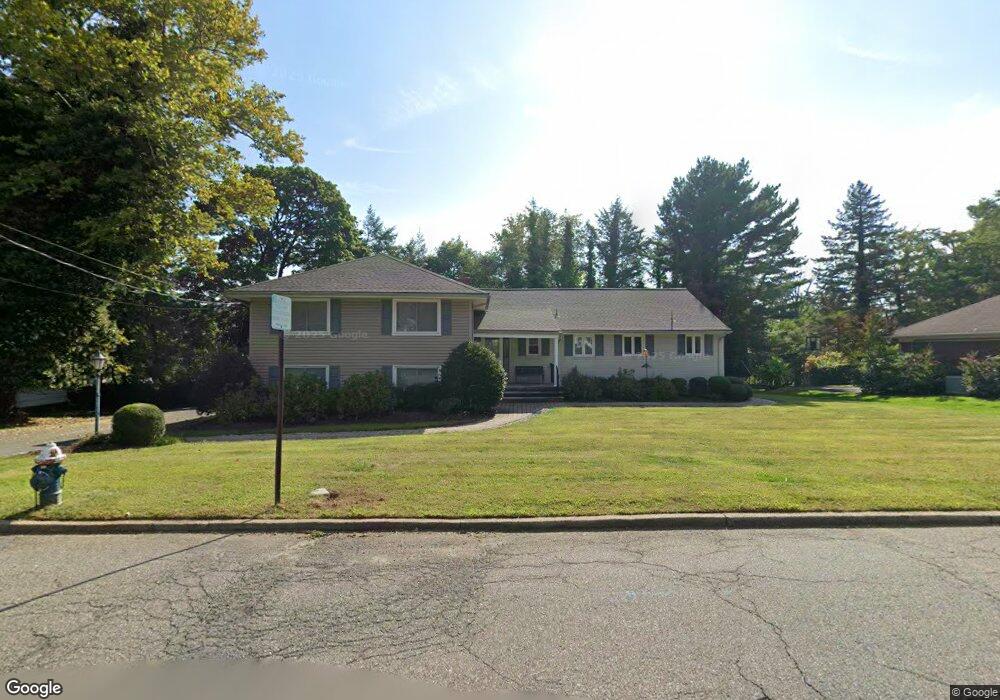
3 Linden Ave West Orange, NJ 07052
Estimated Value: $806,085 - $999,000
--
Bed
--
Bath
2,925
Sq Ft
$295/Sq Ft
Est. Value
About This Home
This home is located at 3 Linden Ave, West Orange, NJ 07052 and is currently estimated at $861,771, approximately $294 per square foot. 3 Linden Ave is a home located in Essex County with nearby schools including West Orange High School, Philip’s Academy Charter School Newark, and Marion P. Thomas Charter School.
Ownership History
Date
Name
Owned For
Owner Type
Purchase Details
Closed on
Jul 15, 2005
Sold by
Broadbelt Iris
Bought by
Rivera Miguel and Rivera Stephanie
Current Estimated Value
Home Financials for this Owner
Home Financials are based on the most recent Mortgage that was taken out on this home.
Original Mortgage
$434,400
Outstanding Balance
$222,499
Interest Rate
5.37%
Mortgage Type
Adjustable Rate Mortgage/ARM
Estimated Equity
$639,272
Purchase Details
Closed on
Aug 14, 1992
Sold by
Temple B Nai Abraham
Bought by
Broadbelt Raymond and Broadbelt Iris
Create a Home Valuation Report for This Property
The Home Valuation Report is an in-depth analysis detailing your home's value as well as a comparison with similar homes in the area
Home Values in the Area
Average Home Value in this Area
Purchase History
| Date | Buyer | Sale Price | Title Company |
|---|---|---|---|
| Rivera Miguel | $543,000 | -- | |
| Broadbelt Raymond | $200,000 | -- |
Source: Public Records
Mortgage History
| Date | Status | Borrower | Loan Amount |
|---|---|---|---|
| Open | Rivera Miguel | $434,400 |
Source: Public Records
Tax History Compared to Growth
Tax History
| Year | Tax Paid | Tax Assessment Tax Assessment Total Assessment is a certain percentage of the fair market value that is determined by local assessors to be the total taxable value of land and additions on the property. | Land | Improvement |
|---|---|---|---|---|
| 2025 | $18,052 | $803,800 | $348,700 | $455,100 |
| 2024 | $18,052 | $392,600 | $155,900 | $236,700 |
| 2022 | $17,420 | $392,600 | $155,900 | $236,700 |
| 2021 | $17,094 | $392,600 | $155,900 | $236,700 |
| 2020 | $16,819 | $392,600 | $155,900 | $236,700 |
| 2019 | $16,336 | $392,600 | $155,900 | $236,700 |
| 2018 | $15,853 | $392,600 | $155,900 | $236,700 |
| 2017 | $15,649 | $392,600 | $155,900 | $236,700 |
| 2016 | $15,272 | $392,600 | $155,900 | $236,700 |
| 2015 | $14,986 | $392,600 | $155,900 | $236,700 |
| 2014 | $14,691 | $392,600 | $155,900 | $236,700 |
Source: Public Records
Map
Nearby Homes