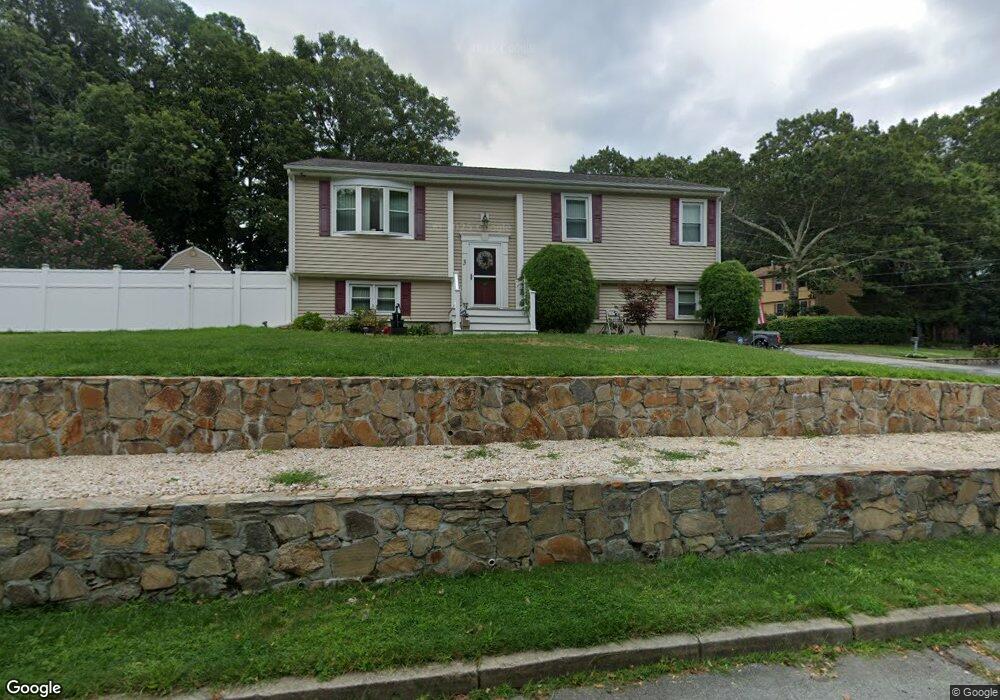
3 Locust Dr West Warwick, RI 02893
Crompton NeighborhoodEstimated Value: $440,000 - $477,000
4
Beds
3
Baths
1,717
Sq Ft
$270/Sq Ft
Est. Value
About This Home
This home is located at 3 Locust Dr, West Warwick, RI 02893 and is currently estimated at $462,897, approximately $269 per square foot. 3 Locust Dr is a home located in Kent County with nearby schools including West Warwick High School.
Ownership History
Date
Name
Owned For
Owner Type
Purchase Details
Closed on
Jan 11, 2001
Sold by
Ajmiri Moin Q and Ajmiri Shereen M
Bought by
Francis Ernest G and Francis Filomena
Current Estimated Value
Home Financials for this Owner
Home Financials are based on the most recent Mortgage that was taken out on this home.
Original Mortgage
$104,000
Interest Rate
7.64%
Purchase Details
Closed on
Jan 11, 2000
Sold by
Ajmiri Moin Q and Ajmiri Shereen M
Bought by
Francis Ernest G and Francis Filomena
Home Financials for this Owner
Home Financials are based on the most recent Mortgage that was taken out on this home.
Original Mortgage
$104,000
Interest Rate
7.73%
Purchase Details
Closed on
Jun 24, 1993
Sold by
Bursie Frank R and Bursie Cathy
Bought by
Lee Chong Oh and Lee Hae
Create a Home Valuation Report for This Property
The Home Valuation Report is an in-depth analysis detailing your home's value as well as a comparison with similar homes in the area
Home Values in the Area
Average Home Value in this Area
Purchase History
| Date | Buyer | Sale Price | Title Company |
|---|---|---|---|
| Francis Ernest G | $130,000 | -- | |
| Francis Ernest G | $130,000 | -- | |
| Lee Chong Oh | $141,000 | -- |
Source: Public Records
Mortgage History
| Date | Status | Borrower | Loan Amount |
|---|---|---|---|
| Open | Lee Chong Oh | $80,000 | |
| Closed | Lee Chong Oh | $104,000 | |
| Previous Owner | Lee Chong Oh | $104,000 | |
| Previous Owner | Lee Chong Oh | $11,935 |
Source: Public Records
Tax History
| Year | Tax Paid | Tax Assessment Tax Assessment Total Assessment is a certain percentage of the fair market value that is determined by local assessors to be the total taxable value of land and additions on the property. | Land | Improvement |
|---|---|---|---|---|
| 2025 | $5,635 | $394,300 | $112,600 | $281,700 |
| 2024 | $5,753 | $307,800 | $89,000 | $218,800 |
| 2023 | $5,639 | $307,800 | $89,000 | $218,800 |
| 2022 | $5,553 | $307,800 | $89,000 | $218,800 |
| 2021 | $5,810 | $252,600 | $71,200 | $181,400 |
| 2020 | $5,810 | $252,600 | $71,200 | $181,400 |
| 2019 | $7,406 | $252,600 | $71,200 | $181,400 |
| 2018 | $5,278 | $194,200 | $69,100 | $125,100 |
| 2017 | $5,109 | $194,200 | $69,100 | $125,100 |
| 2016 | $5,018 | $194,200 | $69,100 | $125,100 |
| 2015 | $4,844 | $186,600 | $69,100 | $117,500 |
| 2014 | $4,738 | $186,600 | $69,100 | $117,500 |
Source: Public Records
Map
Nearby Homes
- 57 Setian Ln
- 19 Turner Dr
- 6 Teresa Ann Crossing
- 36 Cowesett Ave Unit 5
- 4 Teresa Ann Crossing
- 8 Teresa Ann Crossing
- 2 Teresa Ann Crossing
- 500 E Greenwich Ave Unit 124
- 6 Field Ave
- 76 Tiogue Ave
- 3 June Ct
- 1 June Ct
- 52 Kristee Cir Unit 52
- 240 Coit Ave
- 565 Quaker Ln Unit 32
- 650 E Greenwich Ave Unit 5211
- 650 E Greenwich Ave Unit 3102
- 650 E Greenwich Ave Unit 5-110
- 650 E Greenwich Ave Unit 7-207
- 1588 Main St Unit 25
Your Personal Tour Guide
Ask me questions while you tour the home.