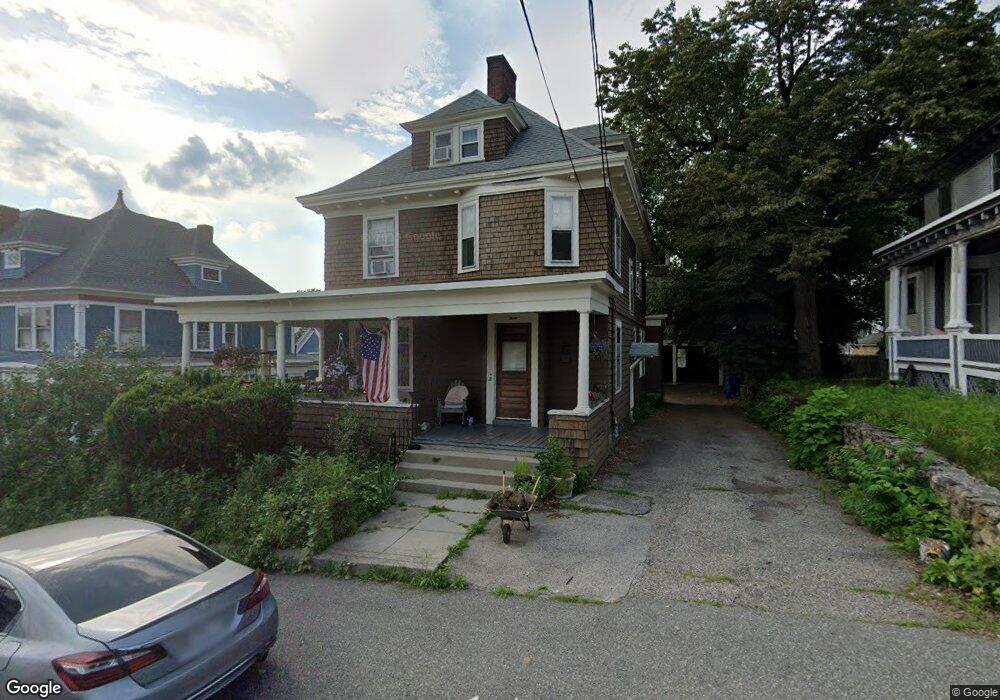
3 Logan St Lawrence, MA 01841
Prospect Hill-Back Bay NeighborhoodEstimated Value: $593,879 - $773,000
5
Beds
3
Baths
1,918
Sq Ft
$348/Sq Ft
Est. Value
About This Home
This home is located at 3 Logan St, Lawrence, MA 01841 and is currently estimated at $667,220, approximately $347 per square foot. 3 Logan St is a home located in Essex County with nearby schools including School For Exceptional Studies, Community Day Charter Public School - Gateway, and Esperanza Academy School of Hope.
Ownership History
Date
Name
Owned For
Owner Type
Purchase Details
Closed on
Oct 28, 1992
Sold by
Cooney James
Bought by
Jani Rebecca J
Current Estimated Value
Home Financials for this Owner
Home Financials are based on the most recent Mortgage that was taken out on this home.
Original Mortgage
$123,500
Interest Rate
7.85%
Mortgage Type
Purchase Money Mortgage
Purchase Details
Closed on
Jul 17, 1987
Sold by
Jordan Lucy M
Bought by
Cooney James
Home Financials for this Owner
Home Financials are based on the most recent Mortgage that was taken out on this home.
Original Mortgage
$100,000
Interest Rate
10.69%
Mortgage Type
Purchase Money Mortgage
Create a Home Valuation Report for This Property
The Home Valuation Report is an in-depth analysis detailing your home's value as well as a comparison with similar homes in the area
Home Values in the Area
Average Home Value in this Area
Purchase History
| Date | Buyer | Sale Price | Title Company |
|---|---|---|---|
| Jani Rebecca J | $130,000 | -- | |
| Cooney James | $148,000 | -- |
Source: Public Records
Mortgage History
| Date | Status | Borrower | Loan Amount |
|---|---|---|---|
| Open | Cooney James | $256,490 | |
| Closed | Cooney James | $123,500 | |
| Previous Owner | Cooney James | $160,000 | |
| Previous Owner | Cooney James | $100,000 |
Source: Public Records
Tax History
| Year | Tax Paid | Tax Assessment Tax Assessment Total Assessment is a certain percentage of the fair market value that is determined by local assessors to be the total taxable value of land and additions on the property. | Land | Improvement |
|---|---|---|---|---|
| 2025 | $4,807 | $546,300 | $148,100 | $398,200 |
| 2024 | $4,338 | $469,000 | $109,500 | $359,500 |
| 2023 | $4,585 | $451,300 | $106,800 | $344,500 |
| 2022 | $4,442 | $388,300 | $106,800 | $281,500 |
| 2021 | $4,335 | $353,300 | $106,800 | $246,500 |
| 2020 | $4,237 | $340,900 | $96,000 | $244,900 |
| 2019 | $3,867 | $282,700 | $86,400 | $196,300 |
| 2018 | $3,544 | $247,500 | $74,300 | $173,200 |
| 2017 | $3,422 | $223,100 | $73,400 | $149,700 |
| 2016 | $3,097 | $199,700 | $53,500 | $146,200 |
| 2015 | $2,879 | $190,400 | $53,500 | $136,900 |
Source: Public Records
Map
Nearby Homes
- 5 Kendrick St
- 14 Court St
- 39 Swan Ave
- 25-27 Bicknell Ave
- 192 Union St
- 12 Annette St
- 129-131 Lexington St
- 109 Ferry St
- 106 Leroy Ave
- 2 Leslie St
- 18 Erhardt Terrace
- 131A Lawrence St Unit 40
- 7 Erhardt Terrace
- 264 E Haverhill St Unit 2
- 89 Newbury St Unit 89B
- 80-82 Haverhill St
- 91 Summer St Unit 2
- 32 Josephine Ave
- 7-9 Bennington St
- 173 Jackson St
- 5 Logan St
- 1 Logan St
- 7 Logan St
- 10 Custer St Unit 12
- 68 Custer St
- 2 Logan St Unit 1
- 2 Logan St
- 4 Logan St Unit 2
- 8 Logan St Unit 10
- 9 Logan St
- 14 Custer St
- 18-20 Custer St
- 18 Custer St Unit 20
- 386 Prospect St
- 15 Logan St
- 24 Custer St
- 22 Custer St Unit 24
- 401 Prospect St
- 395 Prospect St
- 391 Prospect St
Your Personal Tour Guide
Ask me questions while you tour the home.