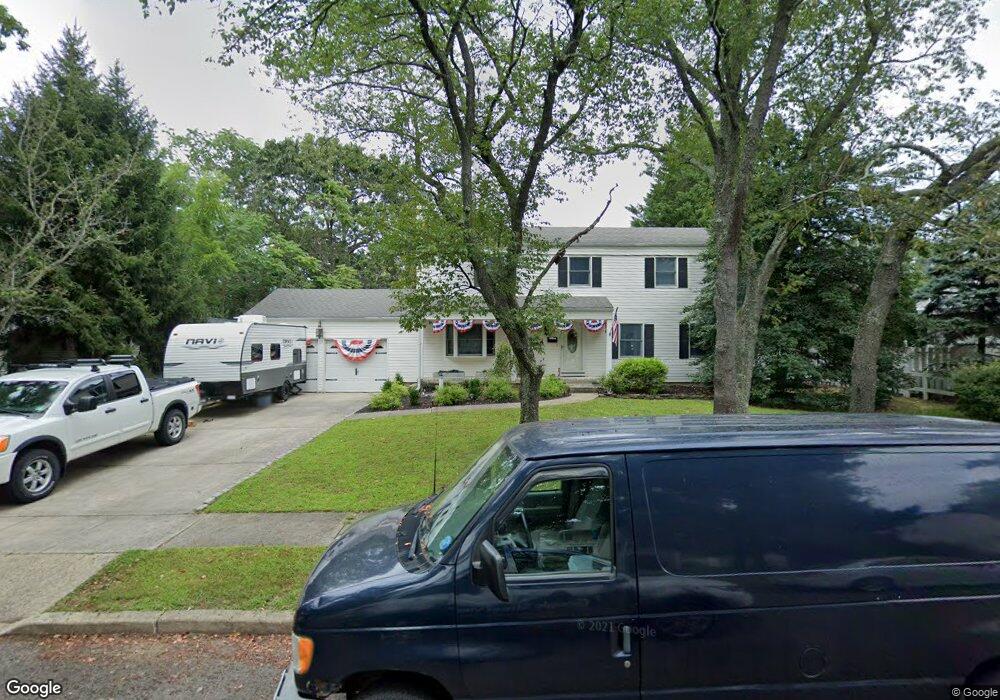
3 Lola Ln Matawan, NJ 07747
Estimated Value: $684,000 - $776,000
4
Beds
3
Baths
1,866
Sq Ft
$380/Sq Ft
Est. Value
About This Home
This home is located at 3 Lola Ln, Matawan, NJ 07747 and is currently estimated at $708,795, approximately $379 per square foot. 3 Lola Ln is a home located in Monmouth County with nearby schools including Matawan Reg High School, St Benedict School, and Matawan Montessori Academy.
Ownership History
Date
Name
Owned For
Owner Type
Purchase Details
Closed on
Oct 7, 2011
Sold by
Smith Harold G
Bought by
Smith Harold G and Smith Lillian E
Current Estimated Value
Purchase Details
Closed on
Jun 17, 2005
Sold by
Perrette John
Bought by
Dimino Michael James and Chinova Yelena
Home Financials for this Owner
Home Financials are based on the most recent Mortgage that was taken out on this home.
Original Mortgage
$384,000
Outstanding Balance
$199,308
Interest Rate
5.67%
Mortgage Type
New Conventional
Estimated Equity
$509,487
Purchase Details
Closed on
Nov 26, 1997
Sold by
Mccaughey William
Bought by
Perrette John and Perrette Donna
Home Financials for this Owner
Home Financials are based on the most recent Mortgage that was taken out on this home.
Original Mortgage
$150,000
Interest Rate
7.11%
Create a Home Valuation Report for This Property
The Home Valuation Report is an in-depth analysis detailing your home's value as well as a comparison with similar homes in the area
Home Values in the Area
Average Home Value in this Area
Purchase History
| Date | Buyer | Sale Price | Title Company |
|---|---|---|---|
| Smith Harold G | -- | None Available | |
| Dimino Michael James | $485,000 | -- | |
| Perrette John | $187,500 | -- |
Source: Public Records
Mortgage History
| Date | Status | Borrower | Loan Amount |
|---|---|---|---|
| Open | Dimino Michael James | $384,000 | |
| Previous Owner | Perrette John | $150,000 |
Source: Public Records
Tax History Compared to Growth
Tax History
| Year | Tax Paid | Tax Assessment Tax Assessment Total Assessment is a certain percentage of the fair market value that is determined by local assessors to be the total taxable value of land and additions on the property. | Land | Improvement |
|---|---|---|---|---|
| 2025 | $12,037 | $595,000 | $308,000 | $287,000 |
| 2024 | $11,718 | $551,400 | $323,000 | $228,400 |
| 2023 | $11,718 | $539,000 | $313,000 | $226,000 |
| 2022 | $10,816 | $450,300 | $235,000 | $215,300 |
| 2021 | $8,153 | $398,100 | $202,000 | $196,100 |
| 2020 | $10,980 | $401,300 | $192,000 | $209,300 |
| 2019 | $10,704 | $392,100 | $188,000 | $204,100 |
| 2018 | $10,670 | $384,500 | $183,000 | $201,500 |
| 2017 | $10,435 | $370,700 | $173,000 | $197,700 |
| 2016 | $10,007 | $363,100 | $168,000 | $195,100 |
| 2015 | $9,307 | $340,300 | $153,000 | $187,300 |
| 2014 | $9,314 | $341,800 | $148,000 | $193,800 |
Source: Public Records
Map
Nearby Homes
- 3 Magnolia Ct
- 160 Freneau Ave
- 119 Freneau Ave
- 10 Somerset Place
- 532 Sloan Ct Unit 532
- 326 Sloan Ct Unit 326
- 207 Lloyd Rd
- 29 Baldwin Ave
- 26 Warren Dr
- 3 Sutphin Ave
- 244 Lloyd Rd
- 8 Sutphin Ave
- 188 Texas Rd
- 114 Greenwood Rd
- 102 Greenwood Rd
- 14 New Brunswick Ave
- 462 Highway 79
- 320 Main St
- 12 S Atlantic Ave Unit 14
- 39 W Aspen Way