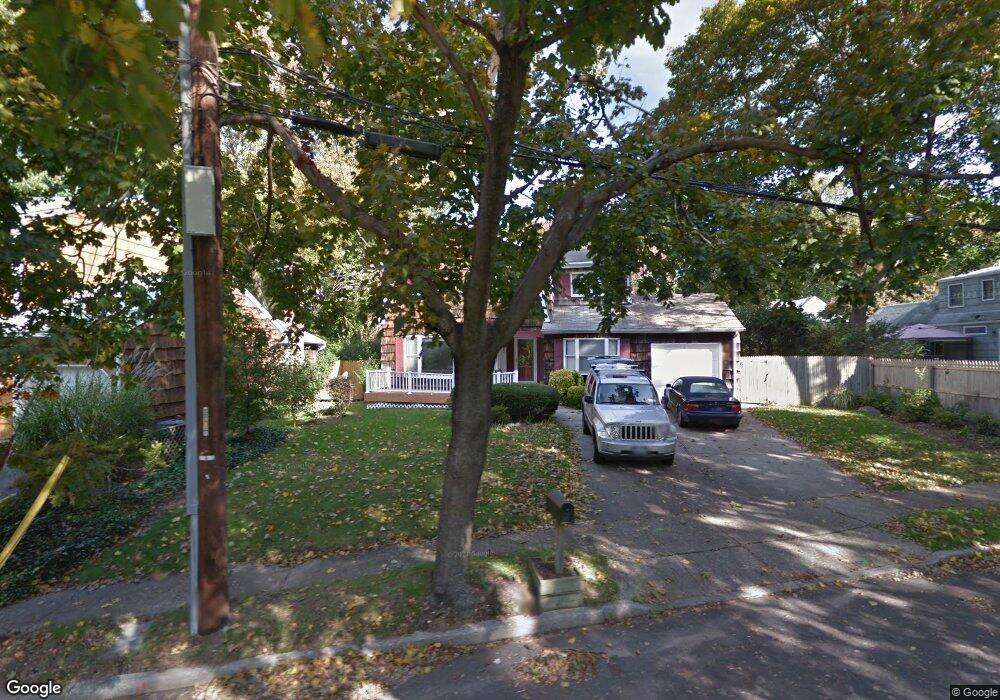
3 Loret Ln East Northport, NY 11731
Estimated Value: $746,249 - $812,000
--
Bed
--
Bath
--
Sq Ft
8,712
Sq Ft Lot
About This Home
This home is located at 3 Loret Ln, East Northport, NY 11731 and is currently estimated at $778,062. 3 Loret Ln is a home located in Suffolk County with nearby schools including Northport Senior High School, The School House, and Trinity Regional School-East Northport Campus.
Ownership History
Date
Name
Owned For
Owner Type
Purchase Details
Closed on
Jun 25, 2016
Sold by
Launer Jessica and Seelinger James
Bought by
Seelinger Jessica and Seelinger James
Current Estimated Value
Home Financials for this Owner
Home Financials are based on the most recent Mortgage that was taken out on this home.
Original Mortgage
$367,100
Outstanding Balance
$291,440
Interest Rate
3.41%
Mortgage Type
New Conventional
Estimated Equity
$486,622
Purchase Details
Closed on
Jan 3, 2012
Sold by
Deutsch Regina P
Bought by
Launer Jessica and Seelinger James
Home Financials for this Owner
Home Financials are based on the most recent Mortgage that was taken out on this home.
Original Mortgage
$382,790
Interest Rate
4.25%
Mortgage Type
FHA
Purchase Details
Closed on
Feb 17, 2000
Sold by
Deutsch Lawrence F and Deutsch Regina P
Bought by
Deutsch Regina P
Create a Home Valuation Report for This Property
The Home Valuation Report is an in-depth analysis detailing your home's value as well as a comparison with similar homes in the area
Home Values in the Area
Average Home Value in this Area
Purchase History
| Date | Buyer | Sale Price | Title Company |
|---|---|---|---|
| Seelinger Jessica | -- | None Available | |
| Launer Jessica | $422,000 | -- | |
| Deutsch Regina P | -- | Fidelity National Title Ins |
Source: Public Records
Mortgage History
| Date | Status | Borrower | Loan Amount |
|---|---|---|---|
| Open | Seelinger Jessica | $367,100 | |
| Closed | Launer Jessica | $382,790 |
Source: Public Records
Tax History Compared to Growth
Tax History
| Year | Tax Paid | Tax Assessment Tax Assessment Total Assessment is a certain percentage of the fair market value that is determined by local assessors to be the total taxable value of land and additions on the property. | Land | Improvement |
|---|---|---|---|---|
| 2024 | $9,403 | $2,930 | $250 | $2,680 |
| 2023 | $4,702 | $2,930 | $250 | $2,680 |
| 2022 | $8,838 | $2,930 | $250 | $2,680 |
| 2021 | $8,559 | $2,930 | $250 | $2,680 |
| 2020 | $8,419 | $2,930 | $250 | $2,680 |
| 2019 | $16,838 | $0 | $0 | $0 |
| 2018 | $8,655 | $3,200 | $250 | $2,950 |
| 2017 | $8,655 | $3,200 | $250 | $2,950 |
| 2016 | $8,512 | $3,200 | $250 | $2,950 |
| 2015 | -- | $3,200 | $250 | $2,950 |
| 2014 | -- | $3,200 | $250 | $2,950 |
Source: Public Records
Map
Nearby Homes