Estimated Value: $635,016 - $819,000
4
Beds
3
Baths
1,756
Sq Ft
$433/Sq Ft
Est. Value
About This Home
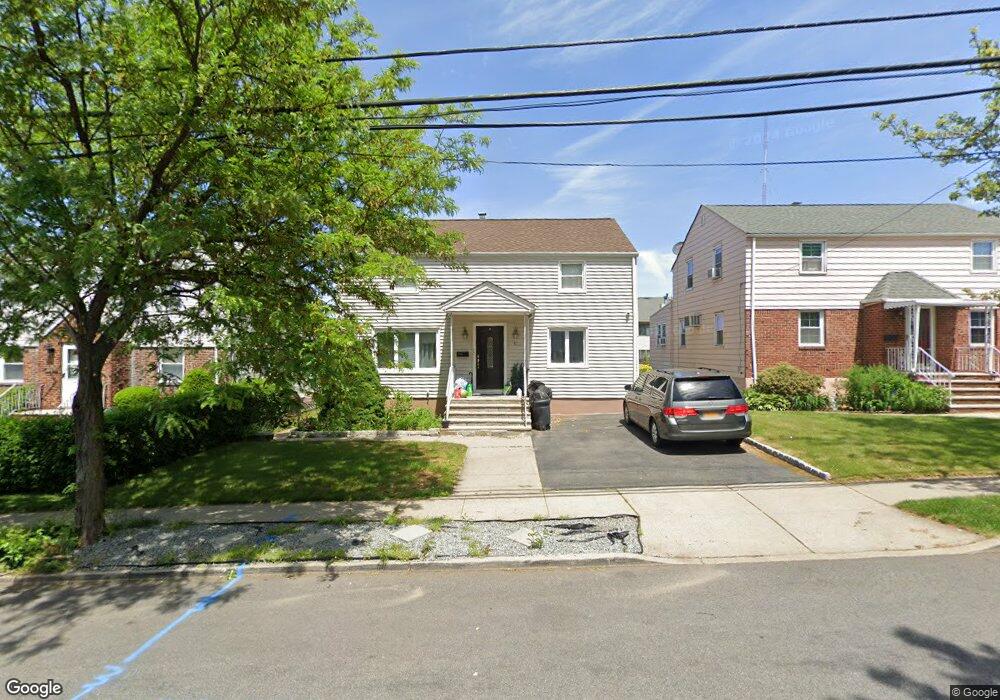
This home is located at 3 Macarthur Ave, Lodi, NJ 07644 and is currently estimated at $759,754, approximately $432 per square foot. 3 Macarthur Ave is a home located in Bergen County with nearby schools including Washington Elementary School, Thomas Jefferson Middle School, and Lodi High School.
Ownership History
Date
Name
Owned For
Owner Type
Purchase Details
Closed on
Oct 31, 2019
Bought by
Cirikovic Azra and Cirikovic Sabina
Current Estimated Value
Purchase Details
Closed on
Oct 27, 2015
Sold by
Acosta Jose A and Acosta Mirta
Home Financials for this Owner
Home Financials are based on the most recent Mortgage that was taken out on this home.
Original Mortgage
$375,081
Interest Rate
3.87%
Mortgage Type
FHA
Purchase Details
Closed on
Apr 25, 1997
Sold by
Kadell Burton
Bought by
Smentkowski Brandon M and Smentkowski Melissa A
Home Financials for this Owner
Home Financials are based on the most recent Mortgage that was taken out on this home.
Original Mortgage
$198,000
Interest Rate
7.88%
Mortgage Type
FHA
Purchase Details
Closed on
Jun 7, 1991
Bought by
Acosta Jose A and Acosta Mirta
Create a Home Valuation Report for This Property
The Home Valuation Report is an in-depth analysis detailing your home's value as well as a comparison with similar homes in the area
Home Values in the Area
Average Home Value in this Area
Purchase History
| Date | Buyer | Sale Price | Title Company |
|---|---|---|---|
| Cirikovic Azra | $525,000 | None Available | |
| -- | $382,000 | Guardian Title Servicing Llc | |
| Smentkowski Brandon M | $203,500 | -- | |
| Acosta Jose A | $175,000 | -- |
Source: Public Records
Mortgage History
| Date | Status | Borrower | Loan Amount |
|---|---|---|---|
| Previous Owner | -- | $375,081 | |
| Previous Owner | Smentkowski Brandon M | $198,000 |
Source: Public Records
Tax History
| Year | Tax Paid | Tax Assessment Tax Assessment Total Assessment is a certain percentage of the fair market value that is determined by local assessors to be the total taxable value of land and additions on the property. | Land | Improvement |
|---|---|---|---|---|
| 2025 | $11,434 | $341,100 | $166,000 | $175,100 |
| 2024 | $11,174 | $341,100 | $166,000 | $175,100 |
| 2023 | $11,134 | $341,100 | $166,000 | $175,100 |
| 2022 | $11,134 | $341,100 | $166,000 | $175,100 |
| 2021 | $11,273 | $341,100 | $166,000 | $175,100 |
| 2020 | $11,205 | $341,100 | $166,000 | $175,100 |
| 2019 | $11,052 | $341,100 | $166,000 | $175,100 |
| 2018 | $11,072 | $341,100 | $166,000 | $175,100 |
| 2017 | $11,058 | $341,100 | $166,000 | $175,100 |
| 2016 | $11,058 | $341,100 | $166,000 | $175,100 |
| 2015 | $10,925 | $341,100 | $166,000 | $175,100 |
| 2014 | $10,891 | $341,100 | $166,000 | $175,100 |
Source: Public Records
Map
Nearby Homes
- 3 Macarthur Ave Unit 2
- 5 Macarthur Ave
- 1 Macarthur Ave
- 1 Macarthur Ave Unit 2FL
- 7 Macarthur Ave
- 14 Short St
- 14 Short St Unit 1st floor
- 266 Garibaldi Ave Unit 9
- 266 Garibaldi Ave
- 266 Garibaldi Ave
- 266 Garibaldi Ave
- 266 Garibaldi Ave
- 266 Garibaldi Ave
- 266 Garibaldi Ave
- 266 Garibaldi Ave
- 266 Garibaldi Ave
- 266 Garibaldi Ave
- 266 Garibaldi Ave Unit 3
- 266 Garibaldi Ave Unit 5
- 266 Garibaldi Ave Unit 7
Your Personal Tour Guide
Ask me questions while you tour the home.