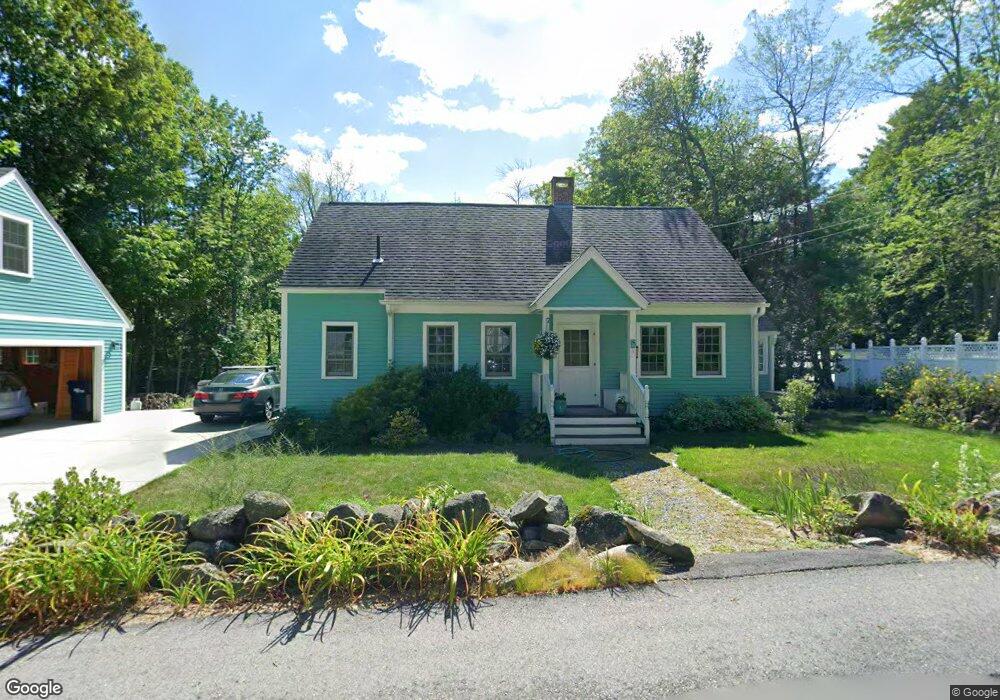
3 Macdowell Rd Peterborough, NH 03458
Estimated Value: $392,038 - $457,000
3
Beds
2
Baths
1,728
Sq Ft
$243/Sq Ft
Est. Value
About This Home
This home is located at 3 Macdowell Rd, Peterborough, NH 03458 and is currently estimated at $420,510, approximately $243 per square foot. 3 Macdowell Rd is a home with nearby schools including Peterborough Elementary School, South Meadow School, and Conval Regional High School.
Ownership History
Date
Name
Owned For
Owner Type
Purchase Details
Closed on
Jun 19, 2017
Sold by
Est Beyer Mary Winsor and Ganson Charles M
Bought by
Bell Andrew C and Bell Carol S
Current Estimated Value
Home Financials for this Owner
Home Financials are based on the most recent Mortgage that was taken out on this home.
Original Mortgage
$140,000
Outstanding Balance
$113,158
Interest Rate
3.38%
Mortgage Type
Adjustable Rate Mortgage/ARM
Estimated Equity
$307,352
Purchase Details
Closed on
May 17, 2005
Sold by
Cheney Susan D
Bought by
Beyer Mary Winsor and Beyer Gordon R
Create a Home Valuation Report for This Property
The Home Valuation Report is an in-depth analysis detailing your home's value as well as a comparison with similar homes in the area
Home Values in the Area
Average Home Value in this Area
Purchase History
| Date | Buyer | Sale Price | Title Company |
|---|---|---|---|
| Bell Andrew C | $180,000 | -- | |
| Beyer Mary Winsor | $267,900 | -- |
Source: Public Records
Mortgage History
| Date | Status | Borrower | Loan Amount |
|---|---|---|---|
| Open | Bell Andrew C | $140,000 |
Source: Public Records
Tax History
| Year | Tax Paid | Tax Assessment Tax Assessment Total Assessment is a certain percentage of the fair market value that is determined by local assessors to be the total taxable value of land and additions on the property. | Land | Improvement |
|---|---|---|---|---|
| 2025 | $9,305 | $286,300 | $76,000 | $210,300 |
| 2024 | $9,305 | $286,300 | $76,000 | $210,300 |
| 2023 | $8,071 | $286,300 | $76,000 | $210,300 |
| 2022 | $7,404 | $286,300 | $76,000 | $210,300 |
| 2021 | $7,375 | $286,300 | $76,000 | $210,300 |
| 2020 | $6,813 | $220,900 | $56,000 | $164,900 |
| 2019 | $6,090 | $204,700 | $56,000 | $148,700 |
| 2018 | $6,159 | $204,700 | $56,000 | $148,700 |
| 2017 | $5,474 | $174,000 | $43,700 | $130,300 |
| 2016 | $5,366 | $174,000 | $43,700 | $130,300 |
| 2015 | $5,170 | $174,000 | $43,700 | $130,300 |
Source: Public Records
Map
Nearby Homes
Your Personal Tour Guide
Ask me questions while you tour the home.