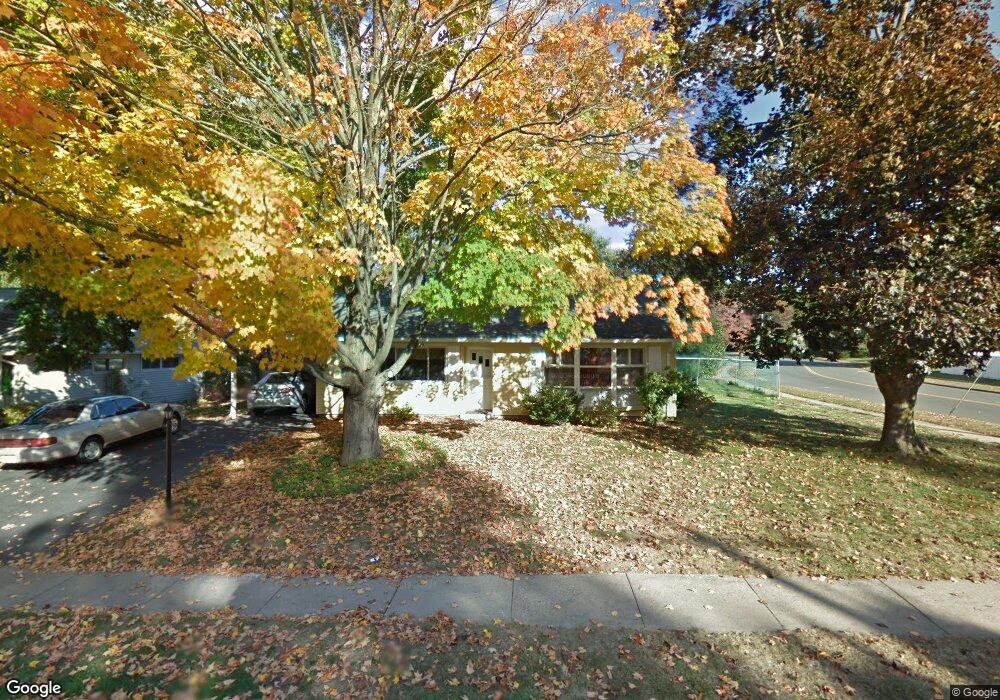
3 Manor Cir East Hartford, CT 06118
Estimated Value: $286,326 - $313,000
2
Beds
1
Bath
1,314
Sq Ft
$226/Sq Ft
Est. Value
About This Home
This home is located at 3 Manor Cir, East Hartford, CT 06118 and is currently estimated at $297,582, approximately $226 per square foot. 3 Manor Cir is a home located in Hartford County with nearby schools including Dr. Thomas S. O'Connell School, East Hartford Middle School, and East Hartford High School.
Ownership History
Date
Name
Owned For
Owner Type
Purchase Details
Closed on
Oct 20, 2004
Sold by
Mcdevitt Raymond R and Mcdevitt Willena
Bought by
Solis Jose L
Current Estimated Value
Home Financials for this Owner
Home Financials are based on the most recent Mortgage that was taken out on this home.
Original Mortgage
$161,182
Interest Rate
5.85%
Purchase Details
Closed on
Jun 27, 1997
Sold by
Dufresne Virginia T
Bought by
Clark-Montaque Carol M
Home Financials for this Owner
Home Financials are based on the most recent Mortgage that was taken out on this home.
Original Mortgage
$89,100
Interest Rate
7.81%
Mortgage Type
Unknown
Create a Home Valuation Report for This Property
The Home Valuation Report is an in-depth analysis detailing your home's value as well as a comparison with similar homes in the area
Home Values in the Area
Average Home Value in this Area
Purchase History
| Date | Buyer | Sale Price | Title Company |
|---|---|---|---|
| Solis Jose L | $162,500 | -- | |
| Clark-Montaque Carol M | $99,000 | -- |
Source: Public Records
Mortgage History
| Date | Status | Borrower | Loan Amount |
|---|---|---|---|
| Open | Clark-Montaque Carol M | $143,350 | |
| Closed | Clark-Montaque Carol M | $161,182 | |
| Previous Owner | Clark-Montaque Carol M | $89,100 |
Source: Public Records
Tax History Compared to Growth
Tax History
| Year | Tax Paid | Tax Assessment Tax Assessment Total Assessment is a certain percentage of the fair market value that is determined by local assessors to be the total taxable value of land and additions on the property. | Land | Improvement |
|---|---|---|---|---|
| 2025 | $5,684 | $123,830 | $42,530 | $81,300 |
| 2024 | $5,449 | $123,830 | $42,530 | $81,300 |
| 2023 | $5,268 | $123,830 | $42,530 | $81,300 |
| 2022 | $5,077 | $123,830 | $42,530 | $81,300 |
| 2021 | $4,495 | $91,080 | $32,220 | $58,860 |
| 2020 | $4,547 | $91,080 | $32,220 | $58,860 |
| 2019 | $4,473 | $91,080 | $32,220 | $58,860 |
| 2018 | $4,341 | $91,080 | $32,220 | $58,860 |
| 2017 | $4,285 | $91,080 | $32,220 | $58,860 |
| 2016 | $4,177 | $91,080 | $32,220 | $58,860 |
| 2015 | $4,177 | $91,080 | $32,220 | $58,860 |
| 2014 | $4,135 | $91,080 | $32,220 | $58,860 |
Source: Public Records
Map
Nearby Homes