3 Maple St Bridgeport, OH 43912
Estimated Value: $26,000 - $164,000
1
Bed
1
Bath
768
Sq Ft
$124/Sq Ft
Est. Value
About This Home
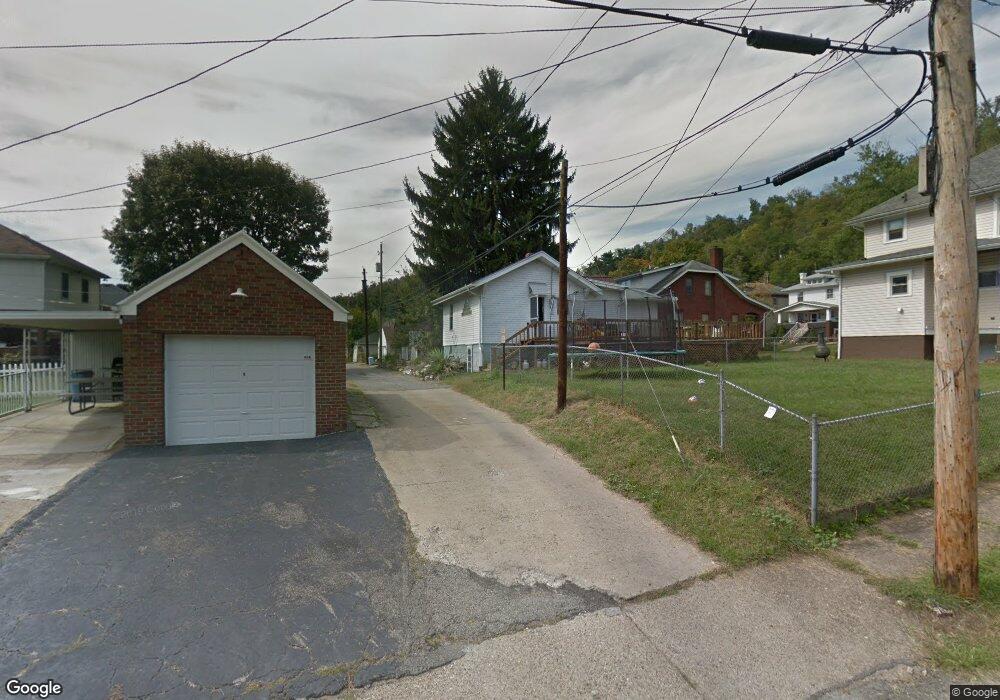
This home is located at 3 Maple St, Bridgeport, OH 43912 and is currently estimated at $95,000, approximately $123 per square foot. 3 Maple St is a home located in Belmont County with nearby schools including Bridgeport Elementary School, Bridgeport Middle School, and Bridgeport High School.
Ownership History
Date
Name
Owned For
Owner Type
Purchase Details
Closed on
Jan 7, 2020
Sold by
Estate Of Michelle Lynn Czoka
Bought by
Czoka Helen
Current Estimated Value
Purchase Details
Closed on
Jan 1, 1987
Sold by
Czoka Michelle
Bought by
Czoka Michelle
Create a Home Valuation Report for This Property
The Home Valuation Report is an in-depth analysis detailing your home's value as well as a comparison with similar homes in the area
Purchase History
| Date | Buyer | Sale Price | Title Company |
|---|---|---|---|
| Czoka Helen | -- | None Available | |
| Czoka Michelle | -- | -- |
Source: Public Records
Tax History
| Year | Tax Paid | Tax Assessment Tax Assessment Total Assessment is a certain percentage of the fair market value that is determined by local assessors to be the total taxable value of land and additions on the property. | Land | Improvement |
|---|---|---|---|---|
| 2025 | $114 | $2,900 | $2,900 | -- |
| 2023 | $124 | $2,900 | $2,900 | $0 |
| 2022 | $476 | $11,336 | $2,898 | $8,438 |
| 2021 | $483 | $11,336 | $2,898 | $8,438 |
| 2020 | $420 | $9,860 | $2,520 | $7,340 |
| 2019 | $665 | $15,630 | $2,520 | $13,110 |
| 2018 | $669 | $15,630 | $2,520 | $13,110 |
| 2017 | $662 | $14,450 | $2,850 | $11,600 |
| 2016 | $843 | $14,450 | $2,850 | $11,600 |
| 2015 | $850 | $14,450 | $2,850 | $11,600 |
| 2014 | $1,244 | $14,550 | $2,590 | $11,960 |
| 2013 | $667 | $14,550 | $2,590 | $11,960 |
Source: Public Records
Map
Nearby Homes
- 4 Walnut Ave
- 13 Prospect St
- 836 Main St
- 26 Elm St
- 56316 National Rd
- 44 Mann St
- 806 Howard St
- 822 W Bennett St
- 56065 National Rd
- 67471 Kirkwood Heights Rd
- 67478 Kirkwood Heights Rd
- 422 Whitely St
- 55935 Main St
- 413 Bennett St
- 67540 Kirkwood Heights Rd
- 67531 Kirkwood Heights Rd
- 308 Whitely St
- TBD Alexander Rd
- 244 Lombardy Heights
- 219 Whitely St
Your Personal Tour Guide
Ask me questions while you tour the home.