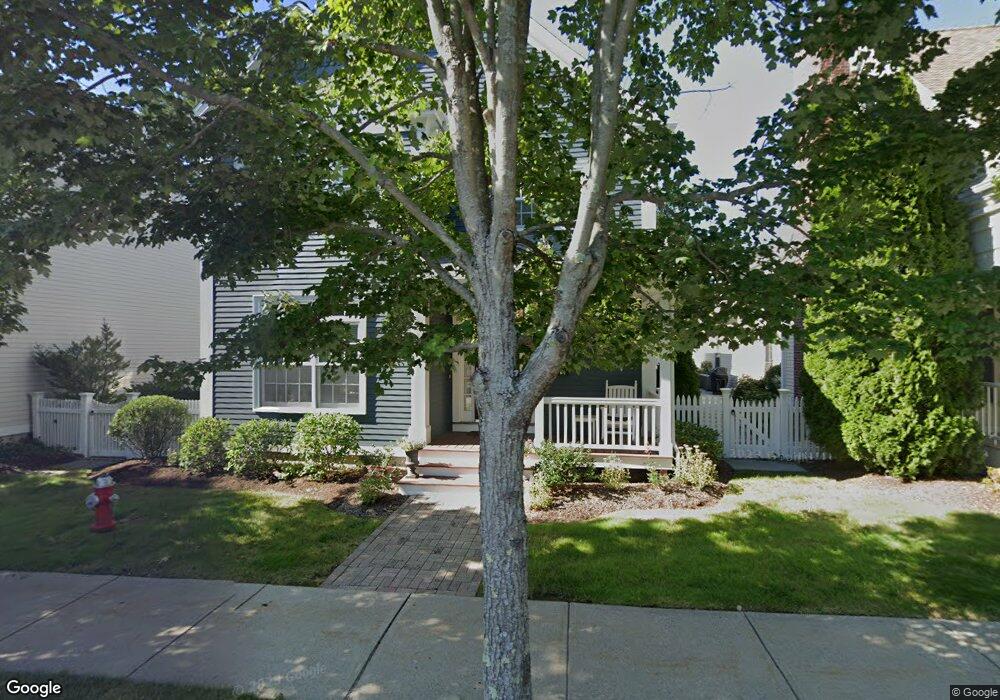
3 Maple St Medfield, MA 02052
Estimated Value: $1,155,441 - $1,309,000
2
Beds
3
Baths
2,480
Sq Ft
$501/Sq Ft
Est. Value
About This Home
This home is located at 3 Maple St, Medfield, MA 02052 and is currently estimated at $1,241,860, approximately $500 per square foot. 3 Maple St is a home located in Norfolk County with nearby schools including Memorial School, Ralph Wheelock School, and Dale Street School.
Ownership History
Date
Name
Owned For
Owner Type
Purchase Details
Closed on
Nov 22, 2021
Sold by
Khanna Teresa and Khanna Rohit
Bought by
Benon Llc
Current Estimated Value
Purchase Details
Closed on
Sep 11, 2017
Sold by
Bunger Fredrick E and Bunger Barbara W
Bought by
Khanna Teresa
Purchase Details
Closed on
May 24, 2007
Sold by
Olde Village Square Co
Bought by
Bunger Fredrick E and Bunger Barbara W
Create a Home Valuation Report for This Property
The Home Valuation Report is an in-depth analysis detailing your home's value as well as a comparison with similar homes in the area
Home Values in the Area
Average Home Value in this Area
Purchase History
| Date | Buyer | Sale Price | Title Company |
|---|---|---|---|
| Benon Llc | $925,000 | None Available | |
| Benon Llc | $925,000 | None Available | |
| Khanna Teresa | $830,000 | -- | |
| Khanna Teresa | $830,000 | -- | |
| Bunger Fredrick E | $817,600 | -- | |
| Bunger Fredrick E | $817,600 | -- |
Source: Public Records
Tax History
| Year | Tax Paid | Tax Assessment Tax Assessment Total Assessment is a certain percentage of the fair market value that is determined by local assessors to be the total taxable value of land and additions on the property. | Land | Improvement |
|---|---|---|---|---|
| 2025 | $13,717 | $994,000 | $0 | $994,000 |
| 2024 | $13,893 | $949,000 | $0 | $949,000 |
| 2023 | $13,708 | $888,400 | $0 | $888,400 |
| 2022 | $14,253 | $818,200 | $0 | $818,200 |
| 2021 | $14,354 | $808,200 | $0 | $808,200 |
| 2020 | $14,410 | $808,200 | $0 | $808,200 |
| 2019 | $14,364 | $803,800 | $0 | $803,800 |
| 2018 | $13,973 | $820,500 | $0 | $820,500 |
| 2017 | $13,858 | $820,500 | $0 | $820,500 |
| 2016 | $13,743 | $820,500 | $0 | $820,500 |
| 2015 | $12,606 | $785,900 | $0 | $785,900 |
| 2014 | $12,412 | $770,000 | $0 | $770,000 |
Source: Public Records
Map
Nearby Homes
Your Personal Tour Guide
Ask me questions while you tour the home.