3 Maple St Norwalk, OH 44857
Estimated Value: $182,000 - $261,000
4
Beds
2
Baths
1,728
Sq Ft
$121/Sq Ft
Est. Value
About This Home
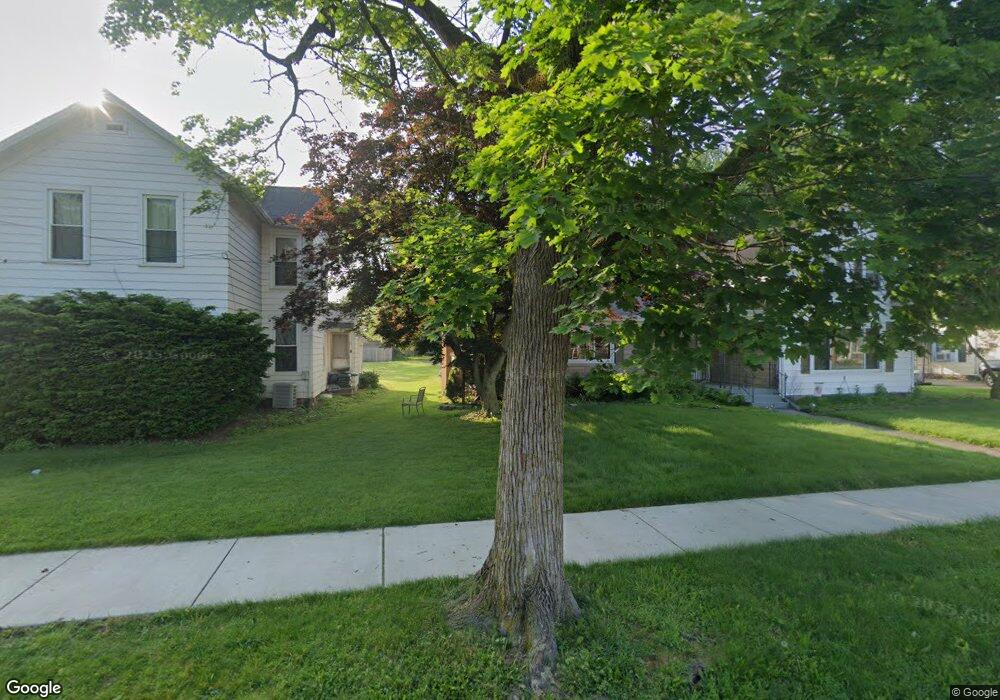
This home is located at 3 Maple St, Norwalk, OH 44857 and is currently estimated at $209,436, approximately $121 per square foot. 3 Maple St is a home located in Huron County with nearby schools including Maplehurst Elementary School, Pleasant Elementary School, and League Elementary School.
Ownership History
Date
Name
Owned For
Owner Type
Purchase Details
Closed on
Apr 7, 2008
Bought by
Hotchkiss Nikki S
Current Estimated Value
Purchase Details
Closed on
Jul 27, 2007
Bought by
Hotchkiss Clyde
Purchase Details
Closed on
Dec 8, 2004
Bought by
James Jason D
Purchase Details
Closed on
Aug 1, 1995
Sold by
Rachel P Stark Est
Bought by
Keefer Ty G and Keefer Shanna
Home Financials for this Owner
Home Financials are based on the most recent Mortgage that was taken out on this home.
Original Mortgage
$40,500
Interest Rate
7.59%
Mortgage Type
New Conventional
Create a Home Valuation Report for This Property
The Home Valuation Report is an in-depth analysis detailing your home's value as well as a comparison with similar homes in the area
Home Values in the Area
Average Home Value in this Area
Purchase History
| Date | Buyer | Sale Price | Title Company |
|---|---|---|---|
| Hotchkiss Nikki S | -- | -- | |
| Hotchkiss Clyde | $129,500 | -- | |
| James Jason D | $125,400 | -- | |
| Keefer Ty G | $76,500 | -- | |
| Keefer Ty Gregory | $76,500 | -- |
Source: Public Records
Mortgage History
| Date | Status | Borrower | Loan Amount |
|---|---|---|---|
| Previous Owner | Keefer Ty Gregory | $40,500 |
Source: Public Records
Tax History Compared to Growth
Tax History
| Year | Tax Paid | Tax Assessment Tax Assessment Total Assessment is a certain percentage of the fair market value that is determined by local assessors to be the total taxable value of land and additions on the property. | Land | Improvement |
|---|---|---|---|---|
| 2024 | $2,494 | $61,110 | $9,540 | $51,570 |
| 2023 | $2,494 | $46,660 | $7,670 | $38,990 |
| 2022 | $1,881 | $46,660 | $7,670 | $38,990 |
| 2021 | $1,882 | $46,660 | $7,670 | $38,990 |
| 2020 | $1,788 | $42,180 | $6,350 | $35,830 |
| 2019 | $1,749 | $42,180 | $6,350 | $35,830 |
| 2018 | $1,718 | $42,180 | $6,350 | $35,830 |
| 2017 | $1,481 | $36,250 | $6,350 | $29,900 |
| 2016 | $1,454 | $36,250 | $6,350 | $29,900 |
| 2015 | $1,449 | $36,160 | $6,360 | $29,800 |
| 2014 | $1,415 | $35,000 | $6,370 | $28,630 |
| 2013 | $1,229 | $35,000 | $6,370 | $28,630 |
Source: Public Records
Map
Nearby Homes