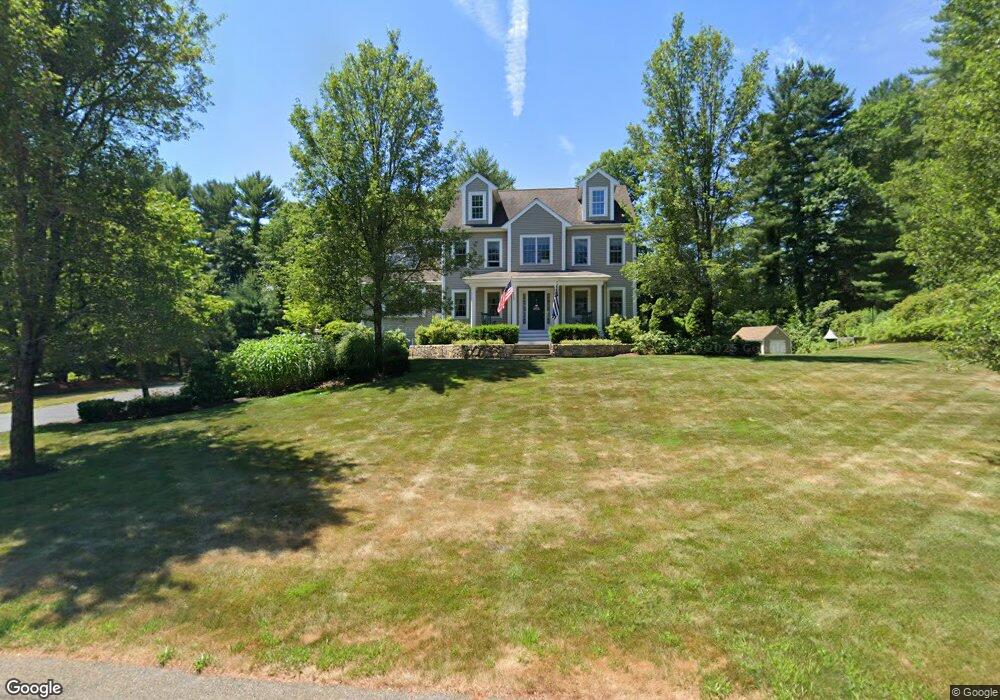
3 Margot Ln East Bridgewater, MA 02333
Estimated Value: $804,707 - $913,000
3
Beds
3
Baths
2,612
Sq Ft
$323/Sq Ft
Est. Value
About This Home
This home is located at 3 Margot Ln, East Bridgewater, MA 02333 and is currently estimated at $844,677, approximately $323 per square foot. 3 Margot Ln is a home located in Plymouth County with nearby schools including Central Elementary School, Gordon W Mitchell Middle School, and East Bridgewater Jr./Sr. High School.
Ownership History
Date
Name
Owned For
Owner Type
Purchase Details
Closed on
Oct 1, 2010
Sold by
Salvatore Philip P and Salvatore Sandra D
Bought by
Harhen Karen A
Current Estimated Value
Home Financials for this Owner
Home Financials are based on the most recent Mortgage that was taken out on this home.
Original Mortgage
$304,900
Outstanding Balance
$202,121
Interest Rate
4.44%
Mortgage Type
Purchase Money Mortgage
Estimated Equity
$642,556
Purchase Details
Closed on
Nov 12, 2003
Sold by
Johnson Edward G
Bought by
Salvatore Philip P and Salvatore Sandra D
Home Financials for this Owner
Home Financials are based on the most recent Mortgage that was taken out on this home.
Original Mortgage
$275,000
Interest Rate
5.81%
Mortgage Type
Purchase Money Mortgage
Create a Home Valuation Report for This Property
The Home Valuation Report is an in-depth analysis detailing your home's value as well as a comparison with similar homes in the area
Home Values in the Area
Average Home Value in this Area
Purchase History
| Date | Buyer | Sale Price | Title Company |
|---|---|---|---|
| Harhen Karen A | $459,900 | -- | |
| Salvatore Philip P | $433,302 | -- |
Source: Public Records
Mortgage History
| Date | Status | Borrower | Loan Amount |
|---|---|---|---|
| Open | Harhen Karen A | $304,900 | |
| Previous Owner | Salvatore Philip P | $337,500 | |
| Previous Owner | Salvatore Philip P | $25,000 | |
| Previous Owner | Salvatore Philip P | $275,000 |
Source: Public Records
Tax History Compared to Growth
Tax History
| Year | Tax Paid | Tax Assessment Tax Assessment Total Assessment is a certain percentage of the fair market value that is determined by local assessors to be the total taxable value of land and additions on the property. | Land | Improvement |
|---|---|---|---|---|
| 2025 | $9,685 | $708,500 | $225,600 | $482,900 |
| 2024 | $9,512 | $687,300 | $216,900 | $470,400 |
| 2023 | $9,339 | $646,300 | $216,900 | $429,400 |
| 2022 | $8,797 | $563,900 | $180,900 | $383,000 |
| 2021 | $5,663 | $509,000 | $173,800 | $335,200 |
| 2020 | $8,534 | $493,600 | $167,100 | $326,500 |
| 2019 | $8,337 | $474,800 | $159,700 | $315,100 |
| 2018 | $8,470 | $471,600 | $159,700 | $311,900 |
| 2017 | $8,122 | $443,800 | $152,300 | $291,500 |
| 2016 | $7,847 | $432,100 | $152,300 | $279,800 |
| 2015 | $7,782 | $438,200 | $151,200 | $287,000 |
| 2014 | $7,431 | $427,800 | $148,100 | $279,700 |
Source: Public Records
Map
Nearby Homes
- 1247 Central St
- 170 Elm St
- 9 Daisy Ln
- 5 Della Way
- 844 Washington St
- 936 Central St
- 72 Phillips St
- 80 Phillips St
- 1 Simmons Place
- 182 Crystal Water Dr Unit 182
- 1054 Main St
- 22 Hudson St
- 217 Crystal Water Dr
- 1993 Washington St
- 51 Stonegate Dr
- 28 Brookbend Way E
- 71 Stonegate Dr
- 78 Crystal Water Dr
- 2045 Washington St
- 587 Bridge St