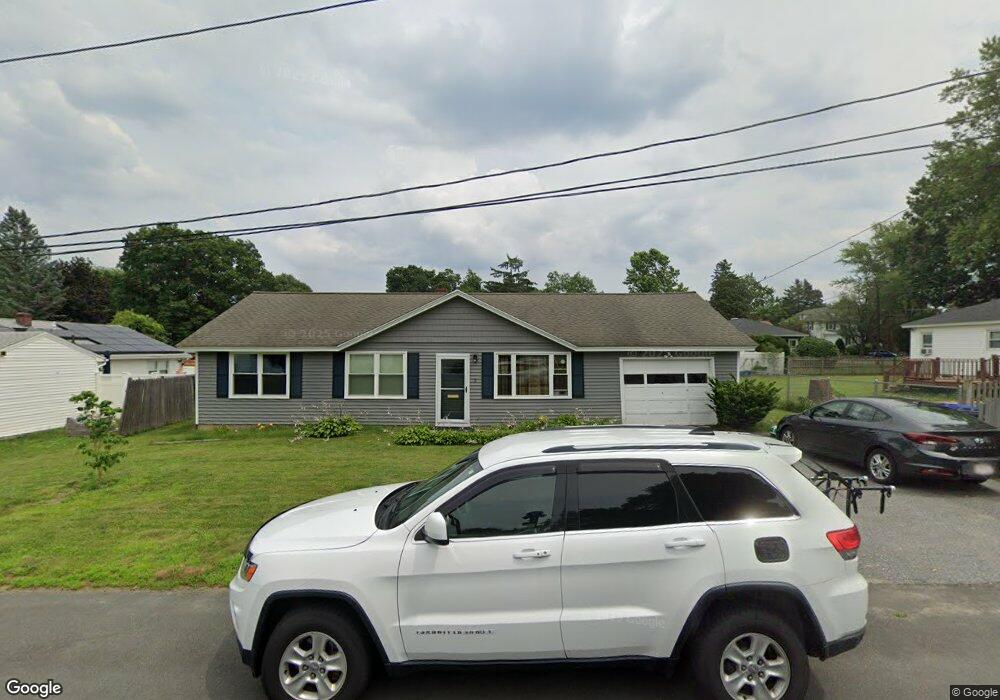
3 Max Ave Methuen, MA 01844
The East End NeighborhoodEstimated Value: $493,000 - $596,000
3
Beds
1
Bath
1,442
Sq Ft
$372/Sq Ft
Est. Value
About This Home
This home is located at 3 Max Ave, Methuen, MA 01844 and is currently estimated at $536,597, approximately $372 per square foot. 3 Max Ave is a home located in Essex County with nearby schools including Timony Grammar School, South Point Elementary School, and Methuen High School.
Ownership History
Date
Name
Owned For
Owner Type
Purchase Details
Closed on
Oct 27, 2004
Sold by
Parolisi
Bought by
Prescott Denise N and Prescott Timothy W
Current Estimated Value
Home Financials for this Owner
Home Financials are based on the most recent Mortgage that was taken out on this home.
Original Mortgage
$251,750
Outstanding Balance
$123,556
Interest Rate
5.74%
Mortgage Type
Purchase Money Mortgage
Estimated Equity
$413,041
Create a Home Valuation Report for This Property
The Home Valuation Report is an in-depth analysis detailing your home's value as well as a comparison with similar homes in the area
Home Values in the Area
Average Home Value in this Area
Purchase History
| Date | Buyer | Sale Price | Title Company |
|---|---|---|---|
| Prescott Denise N | $265,000 | -- | |
| Prescott Denise N | $265,000 | -- |
Source: Public Records
Mortgage History
| Date | Status | Borrower | Loan Amount |
|---|---|---|---|
| Open | Prescott Denise N | $251,750 | |
| Closed | Prescott Denise N | $251,750 |
Source: Public Records
Tax History Compared to Growth
Tax History
| Year | Tax Paid | Tax Assessment Tax Assessment Total Assessment is a certain percentage of the fair market value that is determined by local assessors to be the total taxable value of land and additions on the property. | Land | Improvement |
|---|---|---|---|---|
| 2025 | $4,379 | $413,900 | $201,300 | $212,600 |
| 2024 | $4,303 | $396,200 | $183,600 | $212,600 |
| 2023 | $3,979 | $340,100 | $163,200 | $176,900 |
| 2022 | $3,813 | $292,200 | $136,000 | $156,200 |
| 2021 | $3,586 | $271,900 | $129,200 | $142,700 |
| 2020 | $3,584 | $266,700 | $129,200 | $137,500 |
| 2019 | $3,332 | $234,800 | $115,600 | $119,200 |
| 2018 | $3,268 | $229,000 | $115,600 | $113,400 |
| 2017 | $3,066 | $209,300 | $115,600 | $93,700 |
| 2016 | $2,928 | $197,700 | $108,800 | $88,900 |
| 2015 | $2,844 | $194,800 | $108,800 | $86,000 |
Source: Public Records
Map
Nearby Homes
- 8 Hilbert Terrace
- 10 Baremeadow St
- 30 Seneca St
- 14 Baremeadow St
- 4 Hilbert Terrace
- 4 Max Ave
- 6 Baremeadow St
- 7 Hilbert Terrace
- 12 Max Ave
- 3 Hilbert Terrace
- 49 Milk St Unit 51
- 2 Baremeadow St
- 31 Seneca St
- 16 Baremeadow St
- 35 Seneca St
- 47 Milk St
- 15 Baremeadow St
- 53 Milk St Unit 55
- 39 Seneca St
- 43 Milk St Unit 45