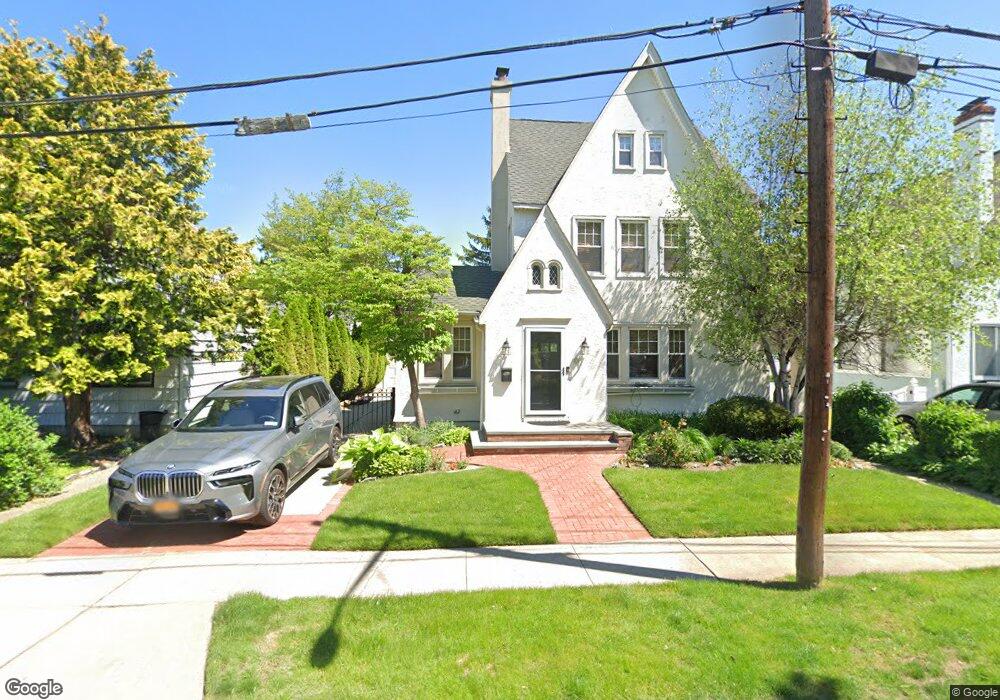
3 May Ct West Hempstead, NY 11552
Estimated Value: $770,549 - $853,000
3
Beds
2
Baths
1,594
Sq Ft
$509/Sq Ft
Est. Value
About This Home
This home is located at 3 May Ct, West Hempstead, NY 11552 and is currently estimated at $811,775, approximately $509 per square foot. 3 May Ct is a home located in Nassau County with nearby schools including Chestnut Street School, West Hempstead Middle School, and West Hempstead Secondary School.
Ownership History
Date
Name
Owned For
Owner Type
Purchase Details
Closed on
Apr 9, 2014
Sold by
Tommony Stephen and Tommony Laura D
Bought by
Nesbitt Erik A and Nesbitt Jennifer
Current Estimated Value
Home Financials for this Owner
Home Financials are based on the most recent Mortgage that was taken out on this home.
Original Mortgage
$417,000
Outstanding Balance
$316,040
Interest Rate
4.26%
Mortgage Type
Cash
Estimated Equity
$495,735
Purchase Details
Closed on
Aug 6, 2012
Sold by
Hanrahan Elizabeth M
Bought by
Elifoglu Ibrahim H
Purchase Details
Closed on
Apr 24, 2009
Sold by
Tommony Stephen J
Bought by
Tommony Stephen J and Tommony Laura D
Purchase Details
Closed on
May 17, 2006
Sold by
Valle Jane Castillo De
Create a Home Valuation Report for This Property
The Home Valuation Report is an in-depth analysis detailing your home's value as well as a comparison with similar homes in the area
Home Values in the Area
Average Home Value in this Area
Purchase History
| Date | Buyer | Sale Price | Title Company |
|---|---|---|---|
| Nesbitt Erik A | $469,000 | -- | |
| Elifoglu Ibrahim H | $430,000 | -- | |
| Tommony Stephen J | -- | Fidelity National Title Ins | |
| -- | $401,000 | -- |
Source: Public Records
Mortgage History
| Date | Status | Borrower | Loan Amount |
|---|---|---|---|
| Open | Nesbitt Erik A | $417,000 |
Source: Public Records
Tax History
| Year | Tax Paid | Tax Assessment Tax Assessment Total Assessment is a certain percentage of the fair market value that is determined by local assessors to be the total taxable value of land and additions on the property. | Land | Improvement |
|---|---|---|---|---|
| 2025 | $14,803 | $537 | $249 | $288 |
| 2024 | $4,666 | $507 | $222 | $285 |
Source: Public Records
Map
Nearby Homes
Your Personal Tour Guide
Ask me questions while you tour the home.