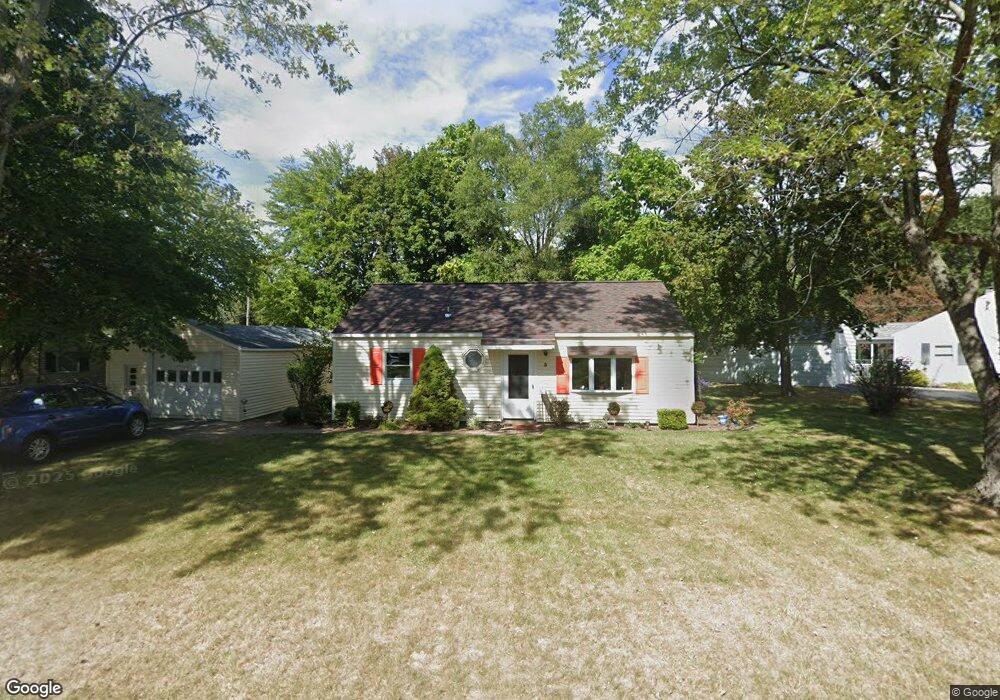
3 Mayhall St Albany, NY 12205
Estimated Value: $228,000 - $254,195
3
Beds
1
Bath
875
Sq Ft
$273/Sq Ft
Est. Value
About This Home
This home is located at 3 Mayhall St, Albany, NY 12205 and is currently estimated at $239,049, approximately $273 per square foot. 3 Mayhall St is a home located in Albany County with nearby schools including Forest Park Elementary School, Sand Creek Middle School, and Colonie Central High School.
Ownership History
Date
Name
Owned For
Owner Type
Purchase Details
Closed on
Jun 26, 2006
Sold by
Swint Cynthia
Bought by
Sommer Jamie N
Current Estimated Value
Home Financials for this Owner
Home Financials are based on the most recent Mortgage that was taken out on this home.
Original Mortgage
$133,950
Outstanding Balance
$78,418
Interest Rate
6.59%
Estimated Equity
$160,631
Create a Home Valuation Report for This Property
The Home Valuation Report is an in-depth analysis detailing your home's value as well as a comparison with similar homes in the area
Home Values in the Area
Average Home Value in this Area
Purchase History
| Date | Buyer | Sale Price | Title Company |
|---|---|---|---|
| Sommer Jamie N | $137,000 | Neil H Rivchin | |
| Sommer Jamie N | $141,000 | Chicago Title Insurance Co |
Source: Public Records
Mortgage History
| Date | Status | Borrower | Loan Amount |
|---|---|---|---|
| Open | Sommer Jamie N | $133,950 | |
| Closed | Sommer Jamie N | $133,950 |
Source: Public Records
Tax History Compared to Growth
Tax History
| Year | Tax Paid | Tax Assessment Tax Assessment Total Assessment is a certain percentage of the fair market value that is determined by local assessors to be the total taxable value of land and additions on the property. | Land | Improvement |
|---|---|---|---|---|
| 2024 | $3,320 | $82,600 | $16,500 | $66,100 |
| 2023 | $3,227 | $82,600 | $16,500 | $66,100 |
| 2022 | $1,863 | $82,600 | $16,500 | $66,100 |
| 2021 | $2,615 | $82,600 | $16,500 | $66,100 |
| 2020 | $2,578 | $82,600 | $16,500 | $66,100 |
| 2019 | $1,857 | $82,600 | $16,500 | $66,100 |
| 2018 | $2,480 | $82,600 | $16,500 | $66,100 |
| 2017 | $0 | $82,600 | $16,500 | $66,100 |
| 2016 | $2,446 | $82,600 | $16,500 | $66,100 |
| 2015 | -- | $82,600 | $16,500 | $66,100 |
| 2014 | -- | $82,600 | $16,500 | $66,100 |
Source: Public Records
Map
Nearby Homes