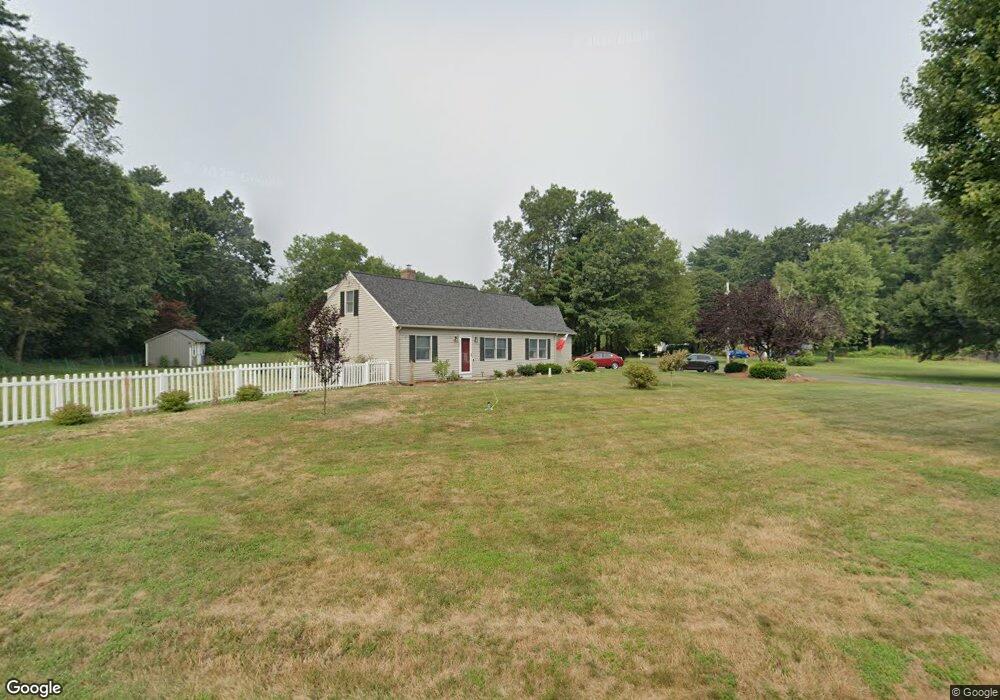
3 Meadowview Rd Wilbraham, MA 01095
Estimated Value: $452,577 - $500,000
4
Beds
2
Baths
1,867
Sq Ft
$255/Sq Ft
Est. Value
About This Home
This home is located at 3 Meadowview Rd, Wilbraham, MA 01095 and is currently estimated at $476,144, approximately $255 per square foot. 3 Meadowview Rd is a home located in Hampden County with nearby schools including Minnechaug Regional High School and Wilbraham & Monson Academy.
Ownership History
Date
Name
Owned For
Owner Type
Purchase Details
Closed on
Sep 27, 2007
Sold by
Lively Michael R
Bought by
Lively Christina
Current Estimated Value
Purchase Details
Closed on
Jun 29, 1995
Sold by
Heeley Robert J and Heeley Janet A
Bought by
Lively Michael R and Lively Christina
Home Financials for this Owner
Home Financials are based on the most recent Mortgage that was taken out on this home.
Original Mortgage
$13,000
Interest Rate
7.84%
Create a Home Valuation Report for This Property
The Home Valuation Report is an in-depth analysis detailing your home's value as well as a comparison with similar homes in the area
Home Values in the Area
Average Home Value in this Area
Purchase History
| Date | Buyer | Sale Price | Title Company |
|---|---|---|---|
| Lively Christina | $135,000 | -- | |
| Lively Michael R | $135,000 | -- |
Source: Public Records
Mortgage History
| Date | Status | Borrower | Loan Amount |
|---|---|---|---|
| Previous Owner | Lively Michael R | $86,500 | |
| Previous Owner | Lively Michael R | $18,000 | |
| Previous Owner | Lively Michael R | $13,000 |
Source: Public Records
Tax History Compared to Growth
Tax History
| Year | Tax Paid | Tax Assessment Tax Assessment Total Assessment is a certain percentage of the fair market value that is determined by local assessors to be the total taxable value of land and additions on the property. | Land | Improvement |
|---|---|---|---|---|
| 2025 | $7,136 | $399,100 | $108,700 | $290,400 |
| 2024 | $6,536 | $353,300 | $108,700 | $244,600 |
| 2023 | $5,737 | $319,300 | $108,700 | $210,600 |
| 2022 | $5,737 | $280,000 | $108,700 | $171,300 |
| 2021 | $5,497 | $239,400 | $116,600 | $122,800 |
| 2020 | $5,358 | $239,400 | $116,600 | $122,800 |
| 2019 | $5,219 | $239,400 | $116,600 | $122,800 |
| 2018 | $5,101 | $225,300 | $116,600 | $108,700 |
| 2017 | $4,957 | $225,300 | $116,600 | $108,700 |
| 2016 | $4,968 | $230,000 | $129,500 | $100,500 |
| 2015 | $4,802 | $230,000 | $129,500 | $100,500 |
Source: Public Records
Map
Nearby Homes
- 374
- 59 Baldwin Dr
- 6 Katie St
- 19 Forest Hill Rd
- 390 Soule Rd
- 230V Burleigh Rd
- 1028 Tinkham Rd
- 460 Soule Rd
- 85 Brookhaven Dr
- 98 Brookhaven Dr
- 4 Millbrook Dr
- 226 Allen St
- 27 Eastwood Dr
- 68 Monson Rd
- 767 Stony Hill Rd
- 25 Angelica Dr
- 72 Tanglewood Dr
- 760 Stony Hill Rd
- 763 Stony Hill Rd
- 331 Grand Valley Rd