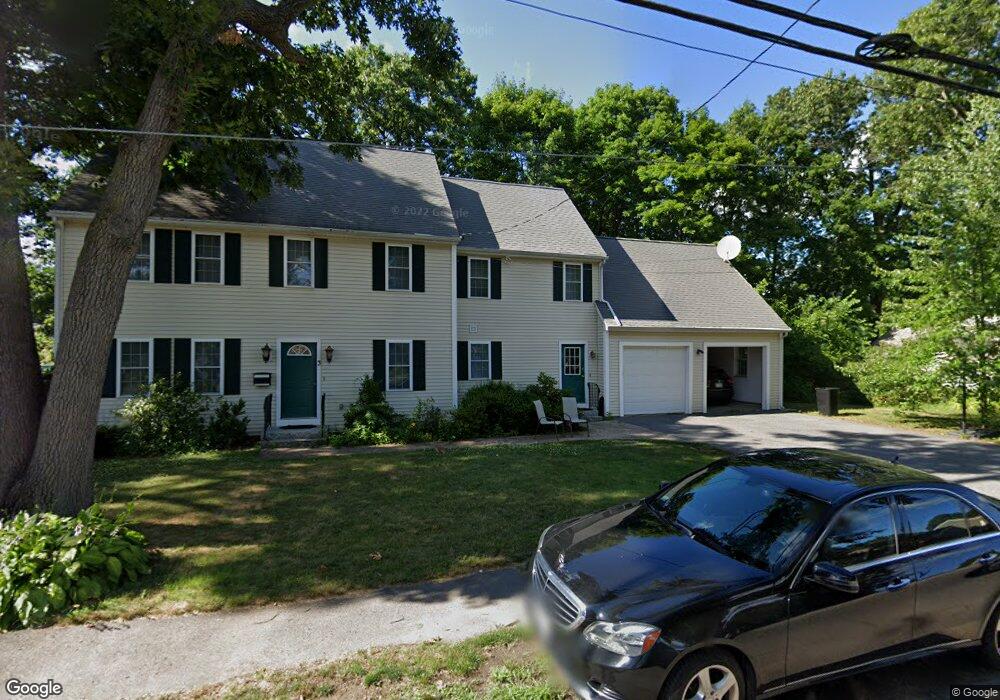
3 Melvin Rd Natick, MA 01760
Estimated Value: $1,110,000 - $1,734,000
4
Beds
4
Baths
3,826
Sq Ft
$364/Sq Ft
Est. Value
About This Home
This home is located at 3 Melvin Rd, Natick, MA 01760 and is currently estimated at $1,390,909, approximately $363 per square foot. 3 Melvin Rd is a home located in Middlesex County with nearby schools including Natick High School, Wilson Middle School, and Bennett-Hemenway (Ben-Hem) Elementary School.
Ownership History
Date
Name
Owned For
Owner Type
Purchase Details
Closed on
Sep 29, 2006
Sold by
Smith Paul G
Bought by
Ghaly Karam
Current Estimated Value
Home Financials for this Owner
Home Financials are based on the most recent Mortgage that was taken out on this home.
Original Mortgage
$564,000
Outstanding Balance
$330,657
Interest Rate
6.52%
Mortgage Type
Purchase Money Mortgage
Estimated Equity
$1,060,252
Purchase Details
Closed on
Oct 7, 2005
Sold by
Mcalister Marcia M and Rutledge Marcia M
Bought by
Smith Paul G
Home Financials for this Owner
Home Financials are based on the most recent Mortgage that was taken out on this home.
Original Mortgage
$490,000
Interest Rate
5.81%
Mortgage Type
Purchase Money Mortgage
Create a Home Valuation Report for This Property
The Home Valuation Report is an in-depth analysis detailing your home's value as well as a comparison with similar homes in the area
Home Values in the Area
Average Home Value in this Area
Purchase History
| Date | Buyer | Sale Price | Title Company |
|---|---|---|---|
| Ghaly Karam | $705,000 | -- | |
| Smith Paul G | $300,000 | -- |
Source: Public Records
Mortgage History
| Date | Status | Borrower | Loan Amount |
|---|---|---|---|
| Open | Ghaly Karam | $564,000 | |
| Previous Owner | Smith Paul G | $490,000 |
Source: Public Records
Tax History
| Year | Tax Paid | Tax Assessment Tax Assessment Total Assessment is a certain percentage of the fair market value that is determined by local assessors to be the total taxable value of land and additions on the property. | Land | Improvement |
|---|---|---|---|---|
| 2025 | $12,099 | $1,011,600 | $425,100 | $586,500 |
| 2024 | $11,663 | $951,300 | $400,100 | $551,200 |
| 2023 | $11,224 | $888,000 | $385,100 | $502,900 |
| 2022 | $10,875 | $815,200 | $350,100 | $465,100 |
| 2021 | $10,427 | $766,100 | $330,100 | $436,000 |
| 2020 | $5,816 | $751,100 | $315,100 | $436,000 |
| 2019 | $5,805 | $751,100 | $315,100 | $436,000 |
| 2018 | $9,217 | $706,300 | $300,100 | $406,200 |
| 2017 | $8,821 | $653,900 | $255,100 | $398,800 |
| 2016 | $8,537 | $629,100 | $234,100 | $395,000 |
| 2015 | $8,184 | $592,200 | $234,100 | $358,100 |
Source: Public Records
Map
Nearby Homes
Your Personal Tour Guide
Ask me questions while you tour the home.