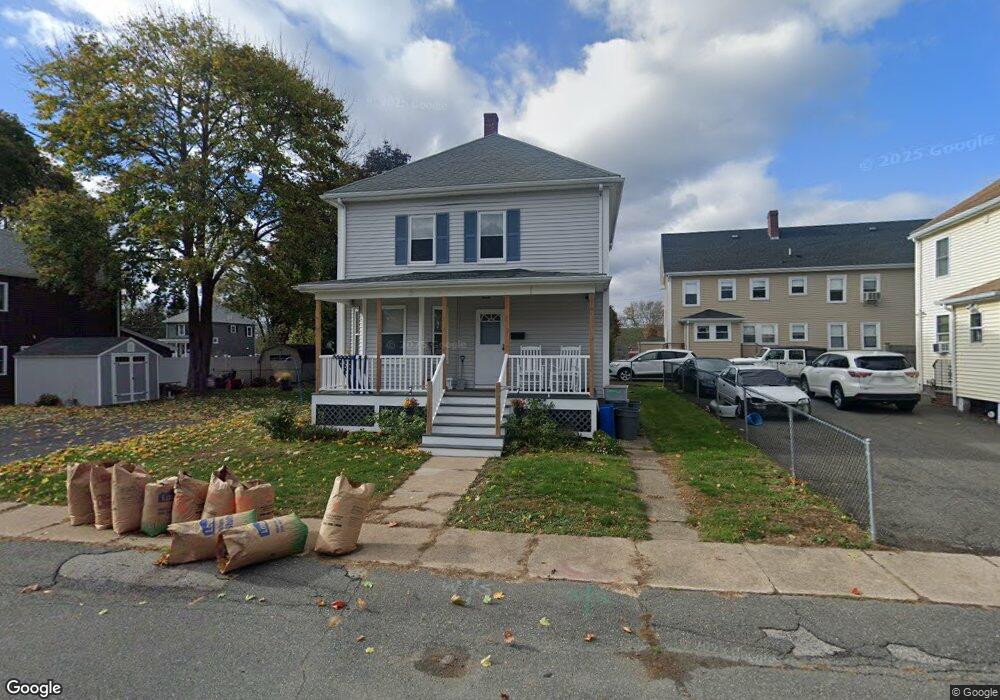
3 Merrill St Danvers, MA 01923
Estimated Value: $584,599 - $614,000
3
Beds
1
Bath
1,311
Sq Ft
$456/Sq Ft
Est. Value
About This Home
This home is located at 3 Merrill St, Danvers, MA 01923 and is currently estimated at $597,900, approximately $456 per square foot. 3 Merrill St is a home located in Essex County with nearby schools including Danvers High School, St. Mary of the Annunciation School, and Bishop Fenwick High School.
Ownership History
Date
Name
Owned For
Owner Type
Purchase Details
Closed on
Sep 28, 2023
Sold by
Carbone Barbara A
Bought by
Carbone 2023 T and Carbone C
Current Estimated Value
Purchase Details
Closed on
Jun 14, 2019
Sold by
Carbone Barbara A and Moroney Mark B
Bought by
Carbone Barbara A
Home Financials for this Owner
Home Financials are based on the most recent Mortgage that was taken out on this home.
Original Mortgage
$200,000
Interest Rate
4%
Mortgage Type
New Conventional
Purchase Details
Closed on
Mar 29, 1996
Sold by
Powers James R and Brunberg Kathleen
Bought by
Moroney Mark B and Moroney Barbara
Home Financials for this Owner
Home Financials are based on the most recent Mortgage that was taken out on this home.
Original Mortgage
$123,500
Interest Rate
6.9%
Mortgage Type
Purchase Money Mortgage
Create a Home Valuation Report for This Property
The Home Valuation Report is an in-depth analysis detailing your home's value as well as a comparison with similar homes in the area
Home Values in the Area
Average Home Value in this Area
Purchase History
| Date | Buyer | Sale Price | Title Company |
|---|---|---|---|
| Carbone 2023 T | -- | None Available | |
| Carbone Barbara A | -- | -- | |
| Moroney Mark B | $130,000 | -- |
Source: Public Records
Mortgage History
| Date | Status | Borrower | Loan Amount |
|---|---|---|---|
| Previous Owner | Carbone Barbara A | $200,000 | |
| Previous Owner | Moroney Mark B | $123,500 |
Source: Public Records
Tax History
| Year | Tax Paid | Tax Assessment Tax Assessment Total Assessment is a certain percentage of the fair market value that is determined by local assessors to be the total taxable value of land and additions on the property. | Land | Improvement |
|---|---|---|---|---|
| 2025 | $5,495 | $500,000 | $321,300 | $178,700 |
| 2024 | $5,254 | $472,900 | $298,700 | $174,200 |
| 2023 | $5,162 | $439,300 | $278,400 | $160,900 |
| 2022 | $5,087 | $401,800 | $253,600 | $148,200 |
| 2021 | $5,053 | $378,500 | $249,800 | $128,700 |
| 2020 | $4,507 | $345,100 | $216,400 | $128,700 |
| 2019 | $4,486 | $337,800 | $202,900 | $134,900 |
| 2018 | $4,543 | $335,500 | $217,600 | $117,900 |
| 2017 | $4,007 | $282,400 | $169,100 | $113,300 |
| 2016 | $3,850 | $271,100 | $161,200 | $109,900 |
| 2015 | $3,720 | $249,500 | $146,500 | $103,000 |
Source: Public Records
Map
Nearby Homes
- 147 High St
- 34 Bayview Terrace Unit 5
- 11 Riverside Ave Unit 111
- 108 Abington Rd Unit 108
- 7 Riverbank Ave Unit 7
- 76 Water St
- 6 Mcdewell Ave Unit 4
- 35 High St Unit 3D
- 59 Riverview Ave
- 5 Holten St
- 63 Adams St
- 152 Endicott St
- 97 Sylvan St Unit 7
- 14 Williams St Unit C17
- 57 Adams St
- 14 Grove St
- 43 Hobart St Unit B
- 508 Elliott St
- 35 Locust St Unit 3
- 22 Maple Ave
- 135 High St Unit 1
- 135 High St
- 135 High St Unit 2
- 5 Merrill St
- 0 High St Unit 72054928
- 0 High St Unit 72139229
- 133 High St
- 1 Hood Terrace
- 6 Hood Terrace
- 8 Merrill St
- 3 Hood Terrace
- 139 High St
- 139 High St
- 139R High St
- 134 High St
- 141 High St
- 141 High St Unit 2
- 132 High St
- 5 Hood Terrace
- 11 Merrill St Unit 2
Your Personal Tour Guide
Ask me questions while you tour the home.