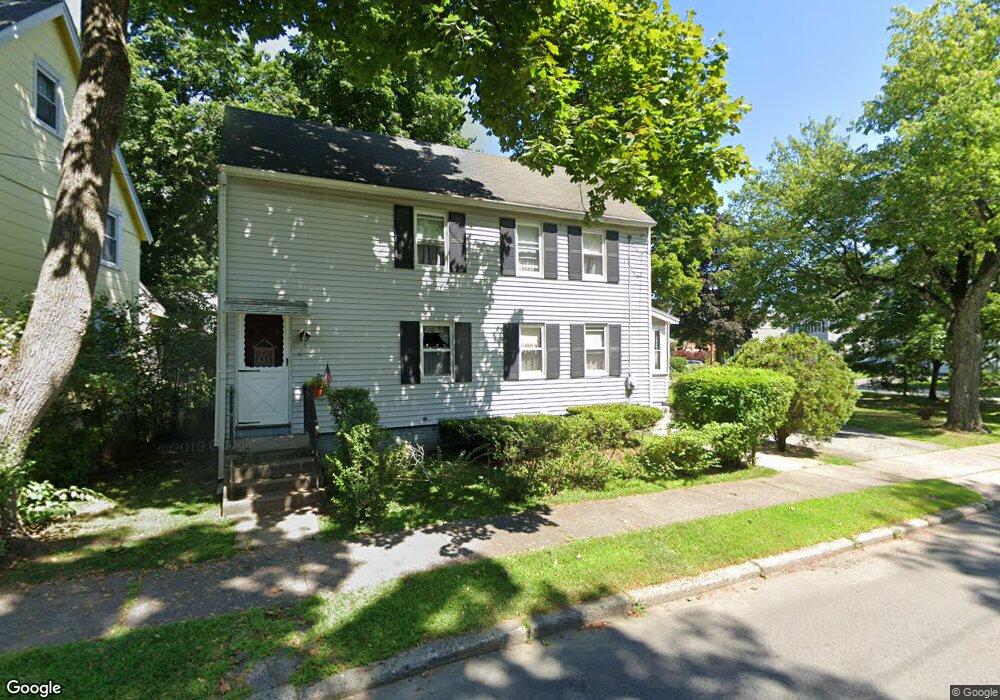
3 Middlesex St Winchester, MA 01890
North Main NeighborhoodEstimated Value: $937,000 - $983,000
3
Beds
4
Baths
1,232
Sq Ft
$776/Sq Ft
Est. Value
About This Home
This home is located at 3 Middlesex St, Winchester, MA 01890 and is currently estimated at $955,676, approximately $775 per square foot. 3 Middlesex St is a home located in Middlesex County with nearby schools including Lynch Elementary School, McCall Middle School, and Winchester High School.
Ownership History
Date
Name
Owned For
Owner Type
Purchase Details
Closed on
Jul 16, 2013
Sold by
Obrien Mary D
Bought by
Obrien Mary B
Current Estimated Value
Purchase Details
Closed on
Jan 6, 1999
Sold by
Serieka Daniel E and Serieka Edward J
Bought by
Obrien Hugh N and Obrien Mary D
Home Financials for this Owner
Home Financials are based on the most recent Mortgage that was taken out on this home.
Original Mortgage
$100,000
Interest Rate
6.8%
Mortgage Type
Purchase Money Mortgage
Create a Home Valuation Report for This Property
The Home Valuation Report is an in-depth analysis detailing your home's value as well as a comparison with similar homes in the area
Home Values in the Area
Average Home Value in this Area
Purchase History
| Date | Buyer | Sale Price | Title Company |
|---|---|---|---|
| Obrien Mary B | -- | -- | |
| Obrien Hugh N | $113,333 | -- |
Source: Public Records
Mortgage History
| Date | Status | Borrower | Loan Amount |
|---|---|---|---|
| Previous Owner | Obrien Hugh N | $100,000 |
Source: Public Records
Tax History
| Year | Tax Paid | Tax Assessment Tax Assessment Total Assessment is a certain percentage of the fair market value that is determined by local assessors to be the total taxable value of land and additions on the property. | Land | Improvement |
|---|---|---|---|---|
| 2025 | $96 | $864,900 | $597,600 | $267,300 |
| 2024 | $9,275 | $818,600 | $566,200 | $252,400 |
| 2023 | $9,058 | $767,600 | $519,000 | $248,600 |
| 2022 | $8,931 | $713,900 | $471,800 | $242,100 |
| 2021 | $8,251 | $643,100 | $401,000 | $242,100 |
| 2020 | $7,968 | $643,100 | $401,000 | $242,100 |
| 2019 | $6,836 | $564,500 | $322,400 | $242,100 |
| 2018 | $6,690 | $548,800 | $306,700 | $242,100 |
| 2017 | $6,303 | $513,300 | $290,900 | $222,400 |
| 2016 | $5,827 | $498,900 | $290,900 | $208,000 |
| 2015 | $5,723 | $471,400 | $263,400 | $208,000 |
| 2014 | $5,197 | $410,500 | $228,000 | $182,500 |
Source: Public Records
Map
Nearby Homes
- 53 Lake St
- 62 Richardson St
- 666 Main St Unit 315
- 200 Swanton St Unit 228
- 200 Swanton St Unit T28
- 237 Swanton St
- 6 Ivy Cir
- 20 Arthur St
- 15 Wildwood St
- 149 Horn Pond Brook Rd
- 8 Russell Rd Unit 10
- 171 Swanton St Unit 73
- 115 Washington St Unit 2A
- 76 Woodside Rd
- 22 Oak St
- 40 Pickering St
- 38 Pickering St Unit A
- 259 Washington St
- 10 Dartmouth St
- 320 Washington St
- 57 Middlesex St
- 5 Fairfield Place
- 11 Middlesex St
- 18 Linden St
- 6 Fairfield Place
- 13 Middlesex St Unit 15
- 61 Lake St
- 14 Linden St
- 17 Linden St
- 17 Linden St Unit 17 Linden St
- 17 Linden St Unit 2
- 57 Lake St
- 15 Linden St
- 19 Middlesex St
- 18 Middlesex St
- 2 Fairfield Place
- 23 Middlesex St
- 13 Linden St
- 30 Middlesex St
- 47 Lake St
Your Personal Tour Guide
Ask me questions while you tour the home.