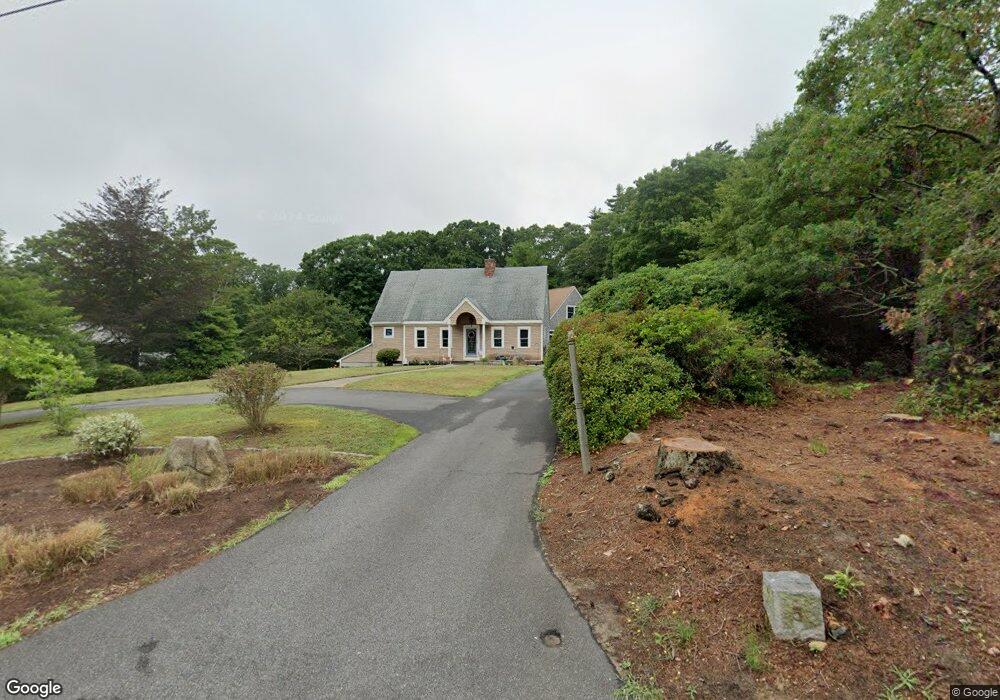
3 Midway Rd Pocasset, MA 02559
Monument Beach NeighborhoodEstimated Value: $711,000 - $798,000
3
Beds
2
Baths
2,235
Sq Ft
$334/Sq Ft
Est. Value
About This Home
This home is located at 3 Midway Rd, Pocasset, MA 02559 and is currently estimated at $747,066, approximately $334 per square foot. 3 Midway Rd is a home located in Barnstable County with nearby schools including Bourne High School, Cadence Academy Preschool - Bourne, and St Margaret Regional School.
Ownership History
Date
Name
Owned For
Owner Type
Purchase Details
Closed on
Aug 28, 2020
Sold by
Perry Charles J and Ronayne-Perry Laurel J
Bought by
Ronayne-Perry Laurel J
Current Estimated Value
Create a Home Valuation Report for This Property
The Home Valuation Report is an in-depth analysis detailing your home's value as well as a comparison with similar homes in the area
Home Values in the Area
Average Home Value in this Area
Purchase History
| Date | Buyer | Sale Price | Title Company |
|---|---|---|---|
| Ronayne-Perry Laurel J | -- | None Available | |
| Ronayne-Perry Laurel J | -- | None Available |
Source: Public Records
Tax History Compared to Growth
Tax History
| Year | Tax Paid | Tax Assessment Tax Assessment Total Assessment is a certain percentage of the fair market value that is determined by local assessors to be the total taxable value of land and additions on the property. | Land | Improvement |
|---|---|---|---|---|
| 2025 | $4,833 | $618,800 | $201,400 | $417,400 |
| 2024 | $4,725 | $589,200 | $191,800 | $397,400 |
| 2023 | $4,594 | $521,400 | $169,700 | $351,700 |
| 2022 | $4,332 | $429,300 | $150,200 | $279,100 |
| 2021 | $4,209 | $390,800 | $136,700 | $254,100 |
| 2020 | $3,960 | $368,700 | $135,400 | $233,300 |
| 2019 | $3,736 | $355,500 | $135,400 | $220,100 |
| 2018 | $3,598 | $341,400 | $129,000 | $212,400 |
| 2017 | $3,193 | $310,000 | $121,300 | $188,700 |
| 2016 | $3,111 | $306,200 | $121,300 | $184,900 |
| 2015 | $2,956 | $293,500 | $108,600 | $184,900 |
Source: Public Records
Map
Nearby Homes
- 566 Shore Rd
- 501 County Rd
- 515 County Rd
- 18 Douglas Ave
- 30 Howard Ave
- 39 Bennets Neck Dr
- 14 Navajo Rd
- 18 Carlton Rd
- 105 Clay Pond Rd
- 93 Valley Bars Rd
- 709 County Rd
- 254 Barlows Landing Rd
- 174 Barlows Landing Rd
- 940 County Rd
- 12 Beachwood Rd
- 70 Wings Neck Rd
- 15 1st St
- 24 Richmond Rd
- 2 Westerly Dr
- 203 County Rd