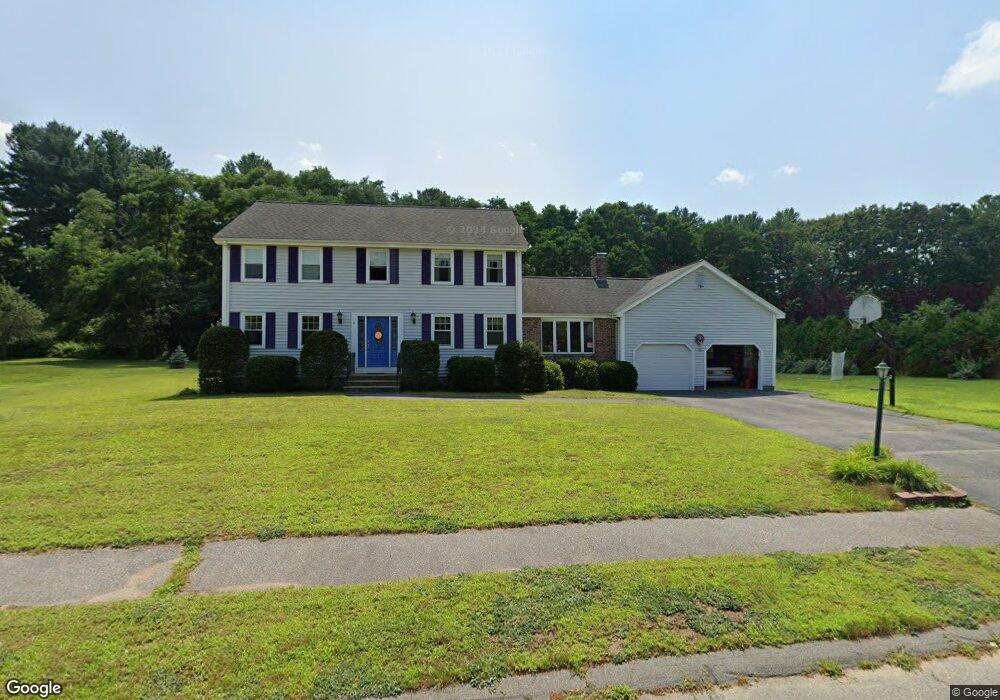
3 Minton Rd Billerica, MA 01821
Pinehurst NeighborhoodEstimated Value: $996,000 - $1,145,000
4
Beds
4
Baths
3,438
Sq Ft
$305/Sq Ft
Est. Value
About This Home
This home is located at 3 Minton Rd, Billerica, MA 01821 and is currently estimated at $1,047,440, approximately $304 per square foot. 3 Minton Rd is a home located in Middlesex County with nearby schools including Billerica Memorial High School.
Ownership History
Date
Name
Owned For
Owner Type
Purchase Details
Closed on
Dec 28, 2015
Sold by
Christensen Thomas G and Christensen Lora L
Bought by
Lora L D Christensen R and Christensen Lora L
Current Estimated Value
Purchase Details
Closed on
Jun 29, 2015
Sold by
Richard John P and Richard Janice A
Bought by
Christensen Thomas G and Christensen Lora L
Home Financials for this Owner
Home Financials are based on the most recent Mortgage that was taken out on this home.
Original Mortgage
$230,000
Interest Rate
3.84%
Mortgage Type
New Conventional
Purchase Details
Closed on
Jun 17, 1994
Sold by
Bowen Robert T
Bought by
Richard John P and Richard Janice A
Create a Home Valuation Report for This Property
The Home Valuation Report is an in-depth analysis detailing your home's value as well as a comparison with similar homes in the area
Home Values in the Area
Average Home Value in this Area
Purchase History
| Date | Buyer | Sale Price | Title Company |
|---|---|---|---|
| Lora L D Christensen R | -- | -- | |
| Christensen Thomas G | $542,750 | -- | |
| Richard John P | $189,000 | -- |
Source: Public Records
Mortgage History
| Date | Status | Borrower | Loan Amount |
|---|---|---|---|
| Previous Owner | Christensen Thomas G | $230,000 | |
| Previous Owner | Richard John P | $100,000 | |
| Previous Owner | Richard John P | $125,000 | |
| Previous Owner | Richard John P | $100,000 |
Source: Public Records
Tax History Compared to Growth
Tax History
| Year | Tax Paid | Tax Assessment Tax Assessment Total Assessment is a certain percentage of the fair market value that is determined by local assessors to be the total taxable value of land and additions on the property. | Land | Improvement |
|---|---|---|---|---|
| 2025 | $10,223 | $899,100 | $382,000 | $517,100 |
| 2024 | $10,065 | $891,500 | $381,900 | $509,600 |
| 2023 | $8,970 | $755,700 | $277,300 | $478,400 |
| 2022 | $8,560 | $677,200 | $278,200 | $399,000 |
| 2021 | $8,540 | $656,900 | $266,400 | $390,500 |
| 2020 | $4,746 | $656,900 | $266,400 | $390,500 |
| 2019 | $4,652 | $597,300 | $240,300 | $357,000 |
| 2018 | $7,637 | $538,200 | $209,800 | $328,400 |
| 2017 | $3,848 | $517,800 | $208,900 | $308,900 |
| 2016 | $7,303 | $516,500 | $207,600 | $308,900 |
| 2015 | $7,003 | $498,800 | $207,600 | $291,200 |
| 2014 | $7,051 | $493,400 | $197,600 | $295,800 |
Source: Public Records
Map
Nearby Homes