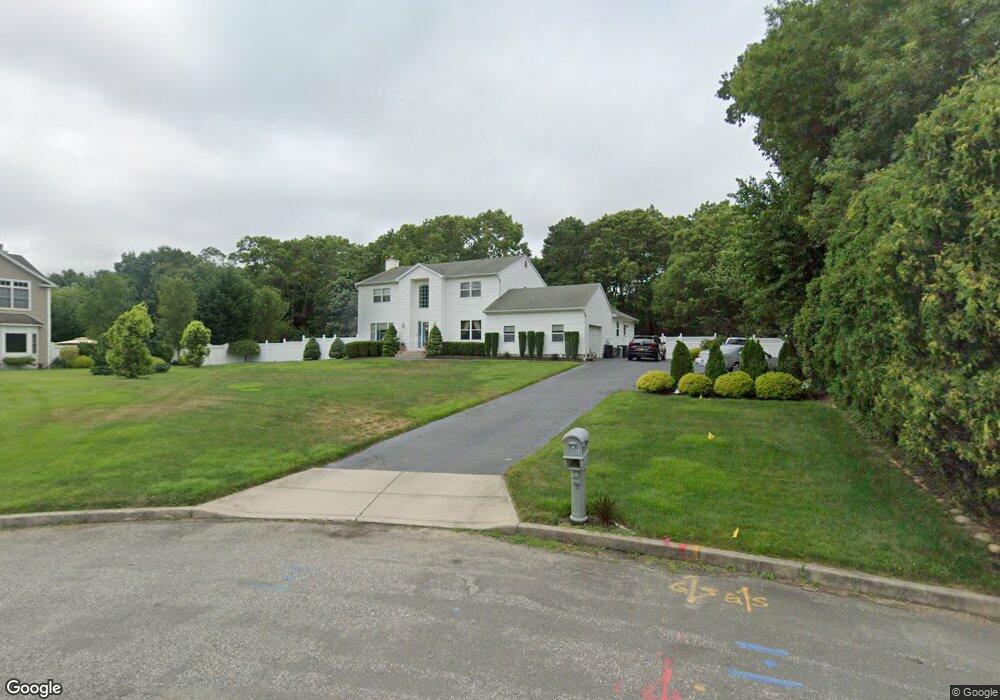
3 Monte Ct Ronkonkoma, NY 11779
Estimated Value: $830,000 - $935,000
4
Beds
2
Baths
3,204
Sq Ft
$274/Sq Ft
Est. Value
About This Home
This home is located at 3 Monte Ct, Ronkonkoma, NY 11779 and is currently estimated at $877,810, approximately $273 per square foot. 3 Monte Ct is a home located in Suffolk County with nearby schools including Chippewa Elementary School, Sagamore Middle School, and Sachem High School East.
Ownership History
Date
Name
Owned For
Owner Type
Purchase Details
Closed on
Apr 18, 2002
Sold by
Genduso Albert
Bought by
Genduso Albert T and Genduso Charlotte
Current Estimated Value
Home Financials for this Owner
Home Financials are based on the most recent Mortgage that was taken out on this home.
Original Mortgage
$176,000
Outstanding Balance
$74,001
Interest Rate
7.01%
Estimated Equity
$803,809
Purchase Details
Closed on
Jun 23, 2000
Sold by
Montefusco Nicholas Louis and Montefusco Nicholas John
Bought by
Genduso Albert
Home Financials for this Owner
Home Financials are based on the most recent Mortgage that was taken out on this home.
Original Mortgage
$160,000
Interest Rate
8.5%
Create a Home Valuation Report for This Property
The Home Valuation Report is an in-depth analysis detailing your home's value as well as a comparison with similar homes in the area
Home Values in the Area
Average Home Value in this Area
Purchase History
| Date | Buyer | Sale Price | Title Company |
|---|---|---|---|
| Genduso Albert T | -- | Stewart Title | |
| Genduso Albert | $256,000 | -- |
Source: Public Records
Mortgage History
| Date | Status | Borrower | Loan Amount |
|---|---|---|---|
| Open | Genduso Albert T | $176,000 | |
| Closed | Genduso Albert | $160,000 |
Source: Public Records
Tax History Compared to Growth
Tax History
| Year | Tax Paid | Tax Assessment Tax Assessment Total Assessment is a certain percentage of the fair market value that is determined by local assessors to be the total taxable value of land and additions on the property. | Land | Improvement |
|---|---|---|---|---|
| 2024 | $11,737 | $3,640 | $350 | $3,290 |
| 2023 | $11,737 | $3,640 | $350 | $3,290 |
| 2022 | $11,342 | $3,640 | $350 | $3,290 |
| 2021 | $11,342 | $3,640 | $350 | $3,290 |
| 2020 | $11,742 | $3,640 | $350 | $3,290 |
| 2019 | $11,742 | $0 | $0 | $0 |
| 2018 | $10,941 | $3,640 | $350 | $3,290 |
| 2017 | $12,082 | $4,000 | $350 | $3,650 |
| 2016 | $12,016 | $4,000 | $350 | $3,650 |
| 2015 | -- | $4,000 | $350 | $3,650 |
| 2014 | -- | $4,000 | $350 | $3,650 |
Source: Public Records
Map
Nearby Homes