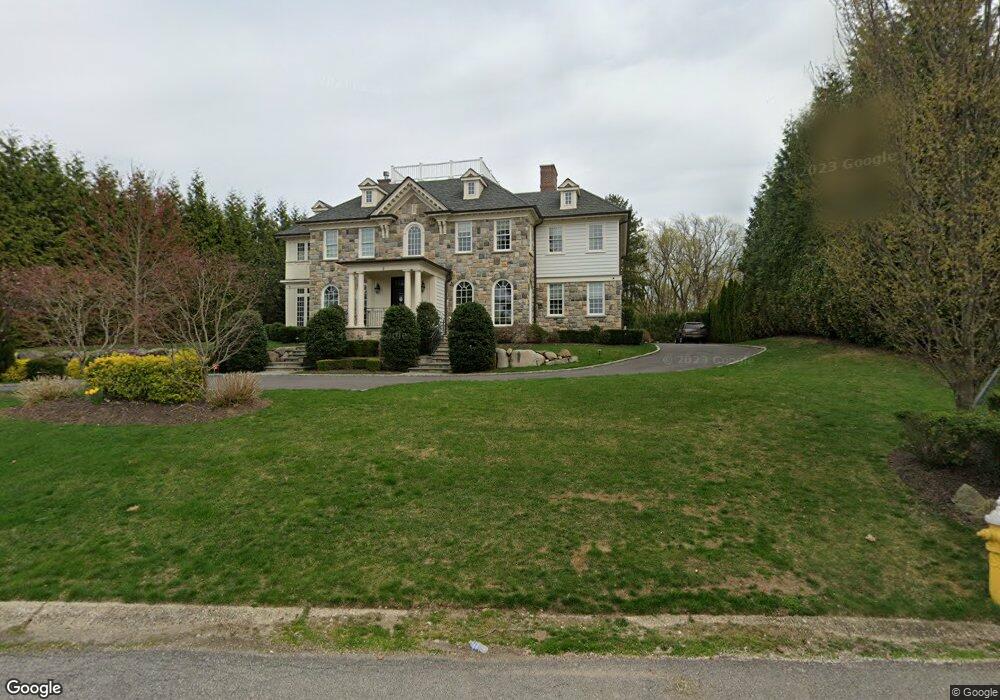
3 Morgan Ct Manhasset, NY 11030
Plandome Manor NeighborhoodEstimated Value: $4,954,091
5
Beds
6
Baths
4,733
Sq Ft
$1,047/Sq Ft
Est. Value
About This Home
This home is located at 3 Morgan Ct, Manhasset, NY 11030 and is currently estimated at $4,954,091, approximately $1,046 per square foot. 3 Morgan Ct is a home located in Nassau County with nearby schools including Manhasset Secondary School, Happy Montessori School, and St Mary's Elementary School.
Ownership History
Date
Name
Owned For
Owner Type
Purchase Details
Closed on
Mar 7, 2016
Sold by
Eris Development Llc
Bought by
Paone Luciano F and Paone Elisa P
Current Estimated Value
Home Financials for this Owner
Home Financials are based on the most recent Mortgage that was taken out on this home.
Original Mortgage
$2,700,000
Outstanding Balance
$2,054,688
Interest Rate
2.62%
Mortgage Type
Adjustable Rate Mortgage/ARM
Estimated Equity
$2,899,403
Create a Home Valuation Report for This Property
The Home Valuation Report is an in-depth analysis detailing your home's value as well as a comparison with similar homes in the area
Home Values in the Area
Average Home Value in this Area
Purchase History
| Date | Buyer | Sale Price | Title Company |
|---|---|---|---|
| Paone Luciano F | $4,417,600 | Zodiac Title Services Llc | |
| Paone Luciano F | $4,417,600 | Zodiac Title Services Llc | |
| Paone Luciano F | $4,417,600 | Zodiac Title Services Llc |
Source: Public Records
Mortgage History
| Date | Status | Borrower | Loan Amount |
|---|---|---|---|
| Open | Paone Luciano F | $2,700,000 | |
| Closed | Paone Luciano F | $2,700,000 |
Source: Public Records
Tax History Compared to Growth
Tax History
| Year | Tax Paid | Tax Assessment Tax Assessment Total Assessment is a certain percentage of the fair market value that is determined by local assessors to be the total taxable value of land and additions on the property. | Land | Improvement |
|---|---|---|---|---|
| 2025 | $47,643 | $3,132 | $1,070 | $2,062 |
| 2024 | $13,351 | $3,254 | $1,112 | $2,142 |
| 2023 | $49,501 | $3,654 | $1,419 | $2,235 |
| 2022 | $49,501 | $3,626 | $1,419 | $2,207 |
| 2021 | $45,688 | $3,421 | $1,064 | $2,357 |
| 2020 | $39,888 | $6,626 | $2,794 | $3,832 |
| 2019 | $60,280 | $6,626 | $2,874 | $3,752 |
| 2018 | $57,055 | $6,820 | $0 | $0 |
| 2017 | $16,182 | $2,958 | $2,958 | $0 |
| 2016 | $23,488 | $2,958 | $2,958 | $0 |
| 2015 | $6,954 | $2,958 | $2,958 | $0 |
| 2014 | $6,954 | $2,958 | $2,958 | $0 |
Source: Public Records
Map
Nearby Homes