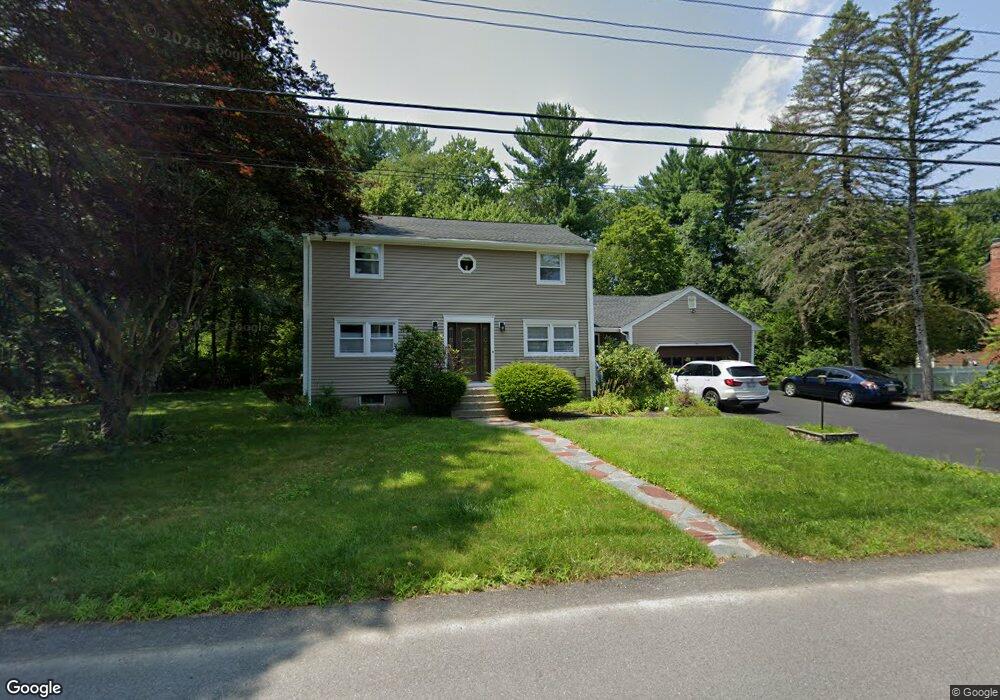
3 Myrna St Burlington, MA 01803
North Burlington NeighborhoodEstimated Value: $914,925 - $1,157,000
4
Beds
2
Baths
2,520
Sq Ft
$411/Sq Ft
Est. Value
About This Home
This home is located at 3 Myrna St, Burlington, MA 01803 and is currently estimated at $1,035,231, approximately $410 per square foot. 3 Myrna St is a home located in Middlesex County with nearby schools including Burlington High School, Fox Hill, and Marshall Simonds Middle School.
Ownership History
Date
Name
Owned For
Owner Type
Purchase Details
Closed on
Jun 26, 2025
Sold by
Hovsepian Levon and Hovhannissian Armine
Bought by
Hovsepian Levon and Hovhannissian Armine
Current Estimated Value
Purchase Details
Closed on
Aug 25, 2011
Sold by
Robert and Robert Natalie Hagel
Bought by
Hovsepian Levon and Hovhannissian Armenuhi
Home Financials for this Owner
Home Financials are based on the most recent Mortgage that was taken out on this home.
Original Mortgage
$439,350
Interest Rate
4.53%
Mortgage Type
Purchase Money Mortgage
Purchase Details
Closed on
Jun 10, 2009
Sold by
Hagel Robert B and Hagel Natalie A
Bought by
Robert and Robert Natalie Hagel
Purchase Details
Closed on
Jul 1, 1994
Sold by
Turri Benito G and Turri Eleanor D
Bought by
Hagel Robert B and Hagel Natalie A
Home Financials for this Owner
Home Financials are based on the most recent Mortgage that was taken out on this home.
Original Mortgage
$128,000
Interest Rate
8.55%
Mortgage Type
Purchase Money Mortgage
Create a Home Valuation Report for This Property
The Home Valuation Report is an in-depth analysis detailing your home's value as well as a comparison with similar homes in the area
Home Values in the Area
Average Home Value in this Area
Purchase History
| Date | Buyer | Sale Price | Title Company |
|---|---|---|---|
| Hovsepian Levon | -- | -- | |
| Hovsepian Levon | $490,000 | -- | |
| Hovsepian Levon | $490,000 | -- | |
| Robert | -- | -- | |
| Robert | -- | -- | |
| Hagel Robert B | $238,000 | -- | |
| Hagel Robert B | $238,000 | -- |
Source: Public Records
Mortgage History
| Date | Status | Borrower | Loan Amount |
|---|---|---|---|
| Previous Owner | Hovsepian Levon | $439,350 | |
| Previous Owner | Hagel Robert B | $128,000 | |
| Previous Owner | Hagel Robert B | $100,000 |
Source: Public Records
Tax History Compared to Growth
Tax History
| Year | Tax Paid | Tax Assessment Tax Assessment Total Assessment is a certain percentage of the fair market value that is determined by local assessors to be the total taxable value of land and additions on the property. | Land | Improvement |
|---|---|---|---|---|
| 2025 | $6,362 | $734,600 | $425,800 | $308,800 |
| 2024 | $6,177 | $690,900 | $403,700 | $287,200 |
| 2023 | $5,945 | $632,400 | $350,700 | $281,700 |
| 2022 | $5,732 | $576,100 | $319,700 | $256,400 |
| 2021 | $10 | $547,100 | $290,700 | $256,400 |
| 2020 | $5,900 | $547,100 | $290,700 | $256,400 |
| 2019 | $11 | $493,100 | $271,700 | $221,400 |
| 2018 | $5,222 | $480,100 | $258,700 | $221,400 |
| 2017 | $5,285 | $480,100 | $258,700 | $221,400 |
| 2016 | $4,893 | $427,000 | $220,700 | $206,300 |
| 2015 | $4,846 | $427,000 | $220,700 | $206,300 |
| 2014 | $4,800 | $400,000 | $200,700 | $199,300 |
Source: Public Records
Map
Nearby Homes