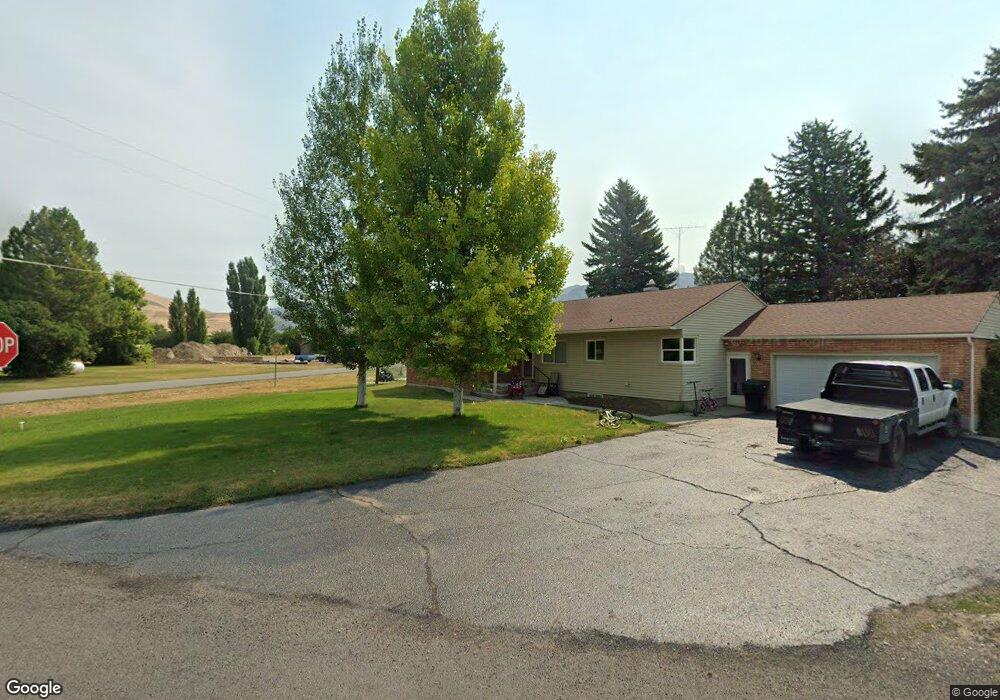
3 N 3rd E Franklin, ID 83237
Estimated Value: $290,015 - $356,000
3
Beds
2
Baths
1,900
Sq Ft
$166/Sq Ft
Est. Value
About This Home
This home is located at 3 N 3rd E, Franklin, ID 83237 and is currently estimated at $315,504, approximately $166 per square foot. 3 N 3rd E is a home located in Franklin County with nearby schools including Oakwood Elementary School, Pioneer Elementary School, and Preston Junior High School.
Ownership History
Date
Name
Owned For
Owner Type
Purchase Details
Closed on
Nov 15, 2021
Sold by
Jorgensen Paysen
Bought by
Oliverson Susanna
Current Estimated Value
Home Financials for this Owner
Home Financials are based on the most recent Mortgage that was taken out on this home.
Original Mortgage
$261,803
Outstanding Balance
$237,435
Interest Rate
3.01%
Mortgage Type
New Conventional
Estimated Equity
$78,069
Purchase Details
Closed on
Apr 11, 2019
Sold by
Montes Alex Kade and Montes Trisha
Bought by
Jorgensen Paysen
Home Financials for this Owner
Home Financials are based on the most recent Mortgage that was taken out on this home.
Original Mortgage
$136,000
Interest Rate
4.3%
Mortgage Type
New Conventional
Purchase Details
Closed on
Oct 23, 2008
Sold by
Robinson Gary Lowe
Bought by
Gould Bruce D and Gould Emma Jean
Home Financials for this Owner
Home Financials are based on the most recent Mortgage that was taken out on this home.
Original Mortgage
$129,125
Interest Rate
4.9%
Mortgage Type
VA
Create a Home Valuation Report for This Property
The Home Valuation Report is an in-depth analysis detailing your home's value as well as a comparison with similar homes in the area
Purchase History
| Date | Buyer | Sale Price | Title Company |
|---|---|---|---|
| Oliverson Susanna | -- | Northern Title Company Of Id | |
| Jorgensen Paysen | -- | Northern Title | |
| Gould Bruce D | -- | -- |
Source: Public Records
Mortgage History
| Date | Status | Borrower | Loan Amount |
|---|---|---|---|
| Open | Oliverson Susanna | $261,803 | |
| Previous Owner | Jorgensen Paysen | $136,000 | |
| Previous Owner | Gould Bruce D | $129,125 |
Source: Public Records
Tax History
| Year | Tax Paid | Tax Assessment Tax Assessment Total Assessment is a certain percentage of the fair market value that is determined by local assessors to be the total taxable value of land and additions on the property. | Land | Improvement |
|---|---|---|---|---|
| 2025 | $1,045 | $255,176 | $60,000 | $195,176 |
| 2024 | $1,080 | $255,176 | $60,000 | $195,176 |
| 2023 | $1,025 | $257,847 | $60,000 | $197,847 |
| 2022 | $1,293 | $241,073 | $43,226 | $197,847 |
| 2021 | $1,219 | $214,688 | $43,226 | $171,462 |
| 2019 | $910 | $118,232 | $43,226 | $75,006 |
| 2018 | $1,107 | $126,081 | $33,015 | $93,066 |
| 2017 | $1,143 | $127,649 | $33,015 | $94,634 |
| 2016 | $986 | $100,605 | $33,015 | $67,590 |
| 2015 | $917 | $90,815 | $33,015 | $57,800 |
| 2014 | $25,232 | $91,714 | $33,014 | $58,700 |
| 2013 | $23,864 | $91,710 | $33,010 | $58,700 |
Source: Public Records
Map
Nearby Homes
- 209 E Main St
- 35 N 2nd E
- 150 N 300 E
- 2307 E Maple Creek Rd Unit 4
- 3647 E Maple Creek Rd
- 483 S 30 E
- 4087 S Highway 91
- 36 W Legacy Dr
- 4008 Little Mountain Cir
- 5337 E Maple Creek Rd Unit 1
- 3201 Cherryville Ln Unit 3
- 50 E 800 N
- 3597 S Mountain Meadows Dr Unit 15
- 11 S Mountain Meadows Dr Unit 11
- 2214 S 1600 E
- 2214 S 1600 E
- 780 N Main St
- 3436 Cub River Rd
- 750 N Main St
- TBD S 1600 E
Your Personal Tour Guide
Ask me questions while you tour the home.