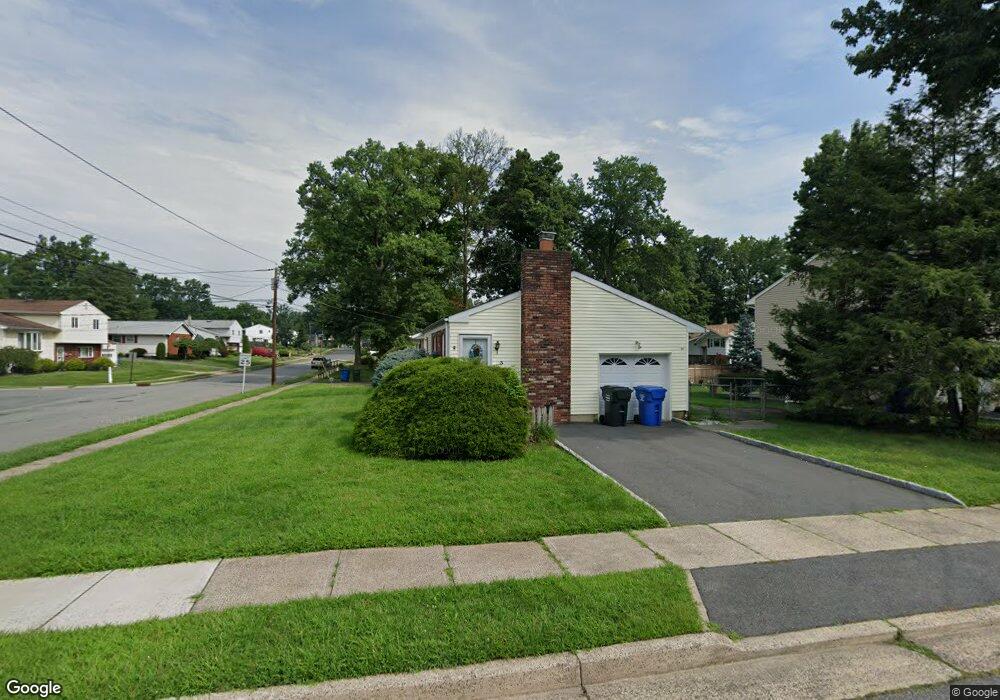
3 N Alice Ct Unit n/a Colonia, NJ 07067
Estimated Value: $543,900 - $624,000
3
Beds
2
Baths
1,255
Sq Ft
$478/Sq Ft
Est. Value
About This Home
This home is located at 3 N Alice Ct Unit n/a, Colonia, NJ 07067 and is currently estimated at $599,975, approximately $478 per square foot. 3 N Alice Ct Unit n/a is a home located in Middlesex County with nearby schools including Oak Ridge Heights Elementary School, Colonia Middle School, and Colonia High School.
Ownership History
Date
Name
Owned For
Owner Type
Purchase Details
Closed on
Nov 12, 2005
Sold by
Smith Richard
Bought by
Nguyen Vinh and Nguyen Dung
Current Estimated Value
Purchase Details
Closed on
Jan 21, 1994
Sold by
Smith Vincent
Bought by
Smith Richard and Smith Karin
Home Financials for this Owner
Home Financials are based on the most recent Mortgage that was taken out on this home.
Original Mortgage
$143,000
Interest Rate
7.11%
Create a Home Valuation Report for This Property
The Home Valuation Report is an in-depth analysis detailing your home's value as well as a comparison with similar homes in the area
Home Values in the Area
Average Home Value in this Area
Purchase History
| Date | Buyer | Sale Price | Title Company |
|---|---|---|---|
| Nguyen Vinh | $385,000 | -- | |
| Smith Richard | $168,000 | -- |
Source: Public Records
Mortgage History
| Date | Status | Borrower | Loan Amount |
|---|---|---|---|
| Previous Owner | Smith Richard | $143,000 |
Source: Public Records
Tax History Compared to Growth
Tax History
| Year | Tax Paid | Tax Assessment Tax Assessment Total Assessment is a certain percentage of the fair market value that is determined by local assessors to be the total taxable value of land and additions on the property. | Land | Improvement |
|---|---|---|---|---|
| 2025 | $10,926 | $90,300 | $25,300 | $65,000 |
| 2024 | $10,690 | $90,300 | $25,300 | $65,000 |
| 2023 | $10,690 | $90,300 | $25,300 | $65,000 |
| 2022 | $10,424 | $90,300 | $25,300 | $65,000 |
| 2021 | $10,338 | $90,300 | $25,300 | $65,000 |
| 2020 | $10,027 | $90,300 | $25,300 | $65,000 |
| 2019 | $9,453 | $87,200 | $25,300 | $61,900 |
| 2018 | $9,274 | $87,200 | $25,300 | $61,900 |
| 2017 | $9,111 | $87,200 | $25,300 | $61,900 |
| 2016 | $9,040 | $87,200 | $25,300 | $61,900 |
| 2015 | $8,881 | $87,200 | $25,300 | $61,900 |
| 2014 | $8,691 | $87,200 | $25,300 | $61,900 |
Source: Public Records
Map
Nearby Homes
- 12 W Clark Place
- 14 Bonnie Ln
- 80 Gaywood Ave
- 41 Clover Ave
- 47 Preston Rd
- 11 Bernice St
- 39 Marlboro Ln
- 47 Marlboro Ln
- 91 Amherst Ave
- 266 Amherst Ave
- 53 Sterling Dr
- 38 Revere Blvd
- 868 Inman Ave
- 35 Revere Blvd
- 64 W Francis St
- 37 E Hegel Ave
- 984 Feather Bed Ln
- 35 W Iselin Pkwy
- 86 Normandy Rd
- 199 E Louis Place