3 N Linden Ln Mendham, NJ 07945
Estimated Value: $929,532 - $982,000
--
Bed
--
Bath
2,401
Sq Ft
$397/Sq Ft
Est. Value
About This Home
This home is located at 3 N Linden Ln, Mendham, NJ 07945 and is currently estimated at $954,383, approximately $397 per square foot. 3 N Linden Ln is a home located in Morris County with nearby schools including Hilltop Elementary School, Mountain View Middle School, and West Morris Mendham High School.
Ownership History
Date
Name
Owned For
Owner Type
Purchase Details
Closed on
Jul 19, 1994
Sold by
Lindblad Richard
Bought by
Ide Tim and Ide Jean
Current Estimated Value
Home Financials for this Owner
Home Financials are based on the most recent Mortgage that was taken out on this home.
Original Mortgage
$200,000
Interest Rate
8.25%
Create a Home Valuation Report for This Property
The Home Valuation Report is an in-depth analysis detailing your home's value as well as a comparison with similar homes in the area
Home Values in the Area
Average Home Value in this Area
Purchase History
| Date | Buyer | Sale Price | Title Company |
|---|---|---|---|
| Ide Tim | $280,000 | -- |
Source: Public Records
Mortgage History
| Date | Status | Borrower | Loan Amount |
|---|---|---|---|
| Closed | Ide Tim | $200,000 |
Source: Public Records
Tax History Compared to Growth
Tax History
| Year | Tax Paid | Tax Assessment Tax Assessment Total Assessment is a certain percentage of the fair market value that is determined by local assessors to be the total taxable value of land and additions on the property. | Land | Improvement |
|---|---|---|---|---|
| 2025 | $14,357 | $583,600 | $361,500 | $222,100 |
| 2024 | $14,322 | $583,600 | $361,500 | $222,100 |
| 2023 | $14,322 | $583,600 | $361,500 | $222,100 |
| 2022 | $13,668 | $583,600 | $361,500 | $222,100 |
| 2021 | $13,668 | $583,600 | $361,500 | $222,100 |
| 2020 | $13,429 | $583,600 | $361,500 | $222,100 |
| 2019 | $13,113 | $583,600 | $361,500 | $222,100 |
| 2018 | $12,927 | $583,600 | $361,500 | $222,100 |
| 2017 | $12,740 | $583,600 | $361,500 | $222,100 |
| 2016 | $12,355 | $583,600 | $361,500 | $222,100 |
| 2015 | $12,081 | $583,600 | $361,500 | $222,100 |
| 2014 | $11,765 | $583,600 | $361,500 | $222,100 |
Source: Public Records
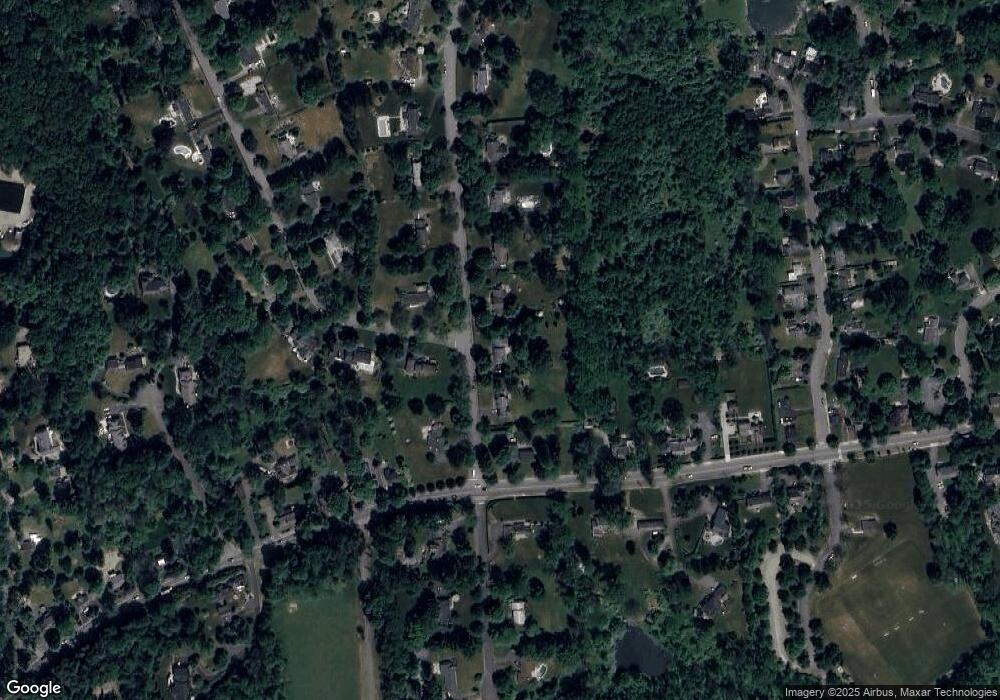
Map
Nearby Homes