Estimated Value: $76,000 - $149,000
--
Bed
1
Bath
1,230
Sq Ft
$91/Sq Ft
Est. Value
About This Home
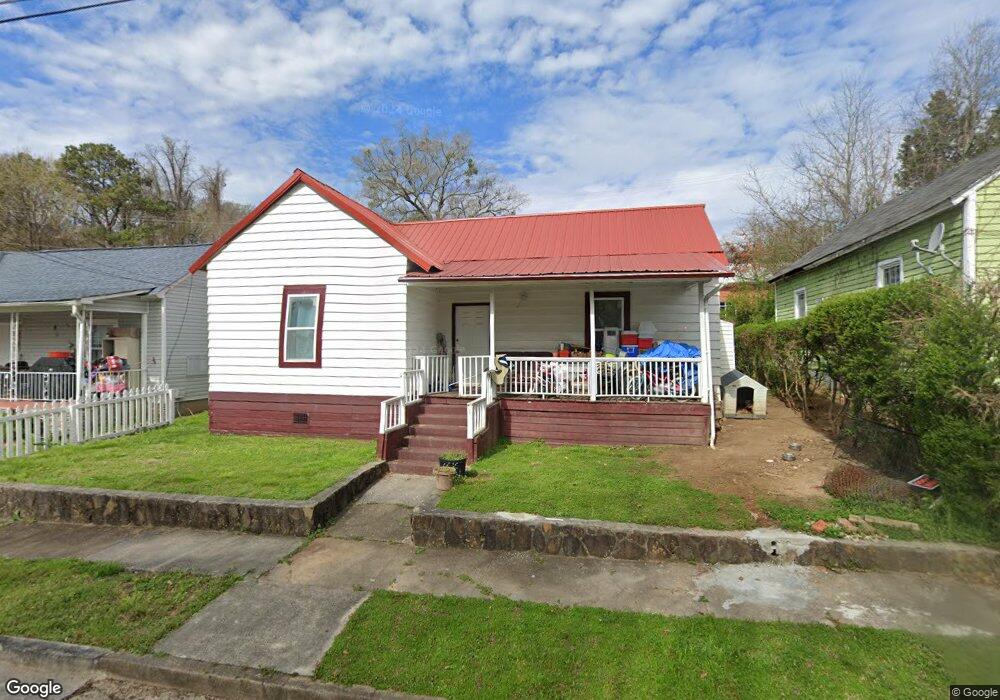
This home is located at 3 N McLin St SW, Rome, GA 30161 and is currently estimated at $112,001, approximately $91 per square foot. 3 N McLin St SW is a home located in Floyd County with nearby schools including Dan McCarty Middle School, Rome High School, and Darlington School.
Ownership History
Date
Name
Owned For
Owner Type
Purchase Details
Closed on
Aug 4, 2017
Sold by
Bonilla Flores Jose G
Bought by
Gomez Flores Aura M
Current Estimated Value
Purchase Details
Closed on
May 31, 2013
Sold by
Flores Jose G Bonilla
Bought by
P and R
Purchase Details
Closed on
Mar 6, 2008
Sold by
Not Provided
Bought by
Flores Jose G and Flores Bonilla
Purchase Details
Closed on
Aug 13, 2004
Sold by
Berry Tom and Jane Berry
Bought by
William S Davies Homeless Shelter I
Purchase Details
Closed on
Mar 2, 1999
Sold by
Shadday Jarrett
Bought by
Berry Tom and Jane Berry
Purchase Details
Closed on
May 22, 1992
Sold by
Parker Gladys T
Bought by
Shadday Jarrett
Purchase Details
Closed on
Jan 23, 1992
Sold by
Ellis Willie G
Bought by
Parker Gladys T
Purchase Details
Closed on
May 20, 1981
Sold by
Ellis Willie Archie Mrs Archie
Bought by
Ellis Willie G
Purchase Details
Closed on
Jan 1, 1901
Bought by
Ellis Willie Archie Mrs Archie
Create a Home Valuation Report for This Property
The Home Valuation Report is an in-depth analysis detailing your home's value as well as a comparison with similar homes in the area
Home Values in the Area
Average Home Value in this Area
Purchase History
| Date | Buyer | Sale Price | Title Company |
|---|---|---|---|
| Gomez Flores Aura M | $28,000 | -- | |
| P | -- | -- | |
| Flores Jose G | $13,500 | -- | |
| Flores Jose G | $13,500 | -- | |
| William S Davies Homeless Shelter I | -- | -- | |
| Berry Tom | $275,000 | -- | |
| Shadday Jarrett | $8,400 | -- | |
| Parker Gladys T | $8,000 | -- | |
| Ellis Willie G | -- | -- | |
| Ellis Willie Archie Mrs Archie | -- | -- |
Source: Public Records
Tax History Compared to Growth
Tax History
| Year | Tax Paid | Tax Assessment Tax Assessment Total Assessment is a certain percentage of the fair market value that is determined by local assessors to be the total taxable value of land and additions on the property. | Land | Improvement |
|---|---|---|---|---|
| 2024 | $352 | $15,786 | $3,476 | $12,310 |
| 2023 | $351 | $10,963 | $3,160 | $7,803 |
| 2022 | $241 | $8,794 | $2,528 | $6,266 |
| 2021 | $231 | $8,029 | $2,528 | $5,501 |
| 2020 | $216 | $7,089 | $1,975 | $5,114 |
| 2019 | $248 | $6,711 | $1,975 | $4,736 |
| 2018 | $232 | $6,271 | $1,975 | $4,296 |
| 2017 | $224 | $6,046 | $1,975 | $4,071 |
| 2016 | $218 | $5,880 | $1,960 | $3,920 |
| 2015 | $206 | $5,880 | $1,960 | $3,920 |
| 2014 | $206 | $5,880 | $1,960 | $3,920 |
Source: Public Records
Map
Nearby Homes
- 5 N McLin St SW
- 1 N McLin St SW
- 3 E 12th St SW
- 7 N McLin St SW
- 0 Cave Spring St SW
- 0 Cave Spring St SW Unit 3120739
- 0 Cave Spring St SW Unit 7377973
- 0 Cave Spring St SW Unit 8303042
- 0 Cave Spring St SW Unit 8440410
- 2 N McLin St SW
- 2 A& B N McLin St
- 0 Spring Creek Farms Unit LOT 24 3178989
- 0 Spring Creek Farms Unit LOT 2 3178988
- 0 Spring Creek Farms Unit LOT 1 3178984
- 9 N McLin St SW
- N N McLin St SW
- N N McLin St SW Unit 13
- 44B N McLin St SW
- 10 N McLin St SW
- 11 N McLin St SW