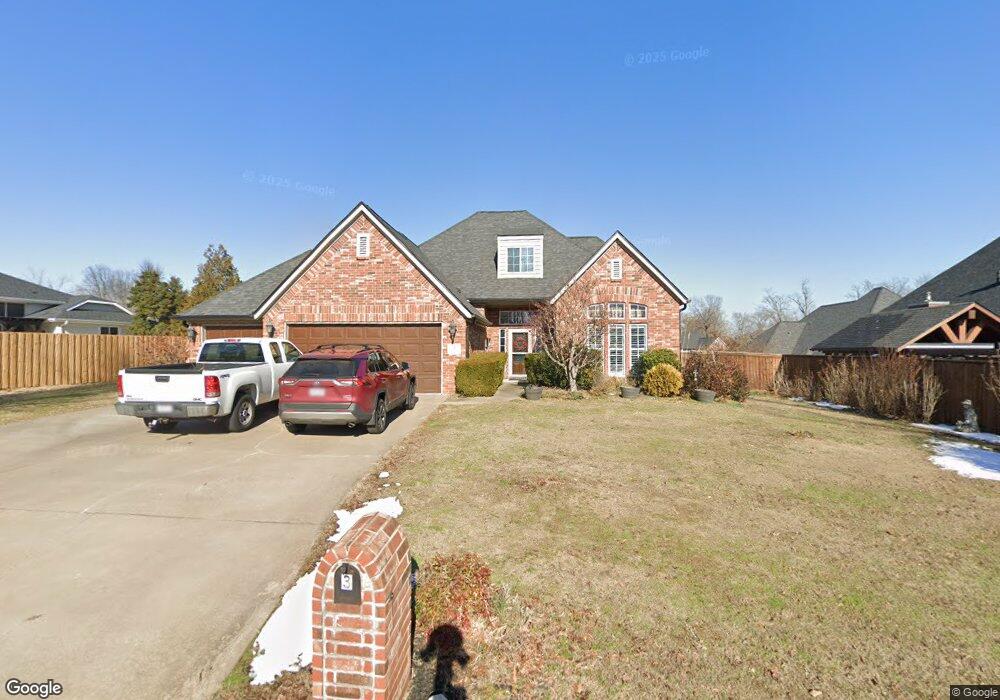
3 NE Harbour Dr Bentonville, AR 72712
Estimated Value: $635,000 - $819,000
--
Bed
4
Baths
3,174
Sq Ft
$224/Sq Ft
Est. Value
About This Home
This home is located at 3 NE Harbour Dr, Bentonville, AR 72712 and is currently estimated at $711,739, approximately $224 per square foot. 3 NE Harbour Dr is a home located in Benton County with nearby schools including Ruth Barker Middle School, Apple Glen Elementary School, and Washington Junior High School.
Ownership History
Date
Name
Owned For
Owner Type
Purchase Details
Closed on
Jun 30, 2006
Sold by
Woods Creek Property Owners Assn Inc
Bought by
Bagwell Mark M and Bagwell Wilma
Current Estimated Value
Purchase Details
Closed on
Jun 17, 2005
Sold by
Boos Builders Inc
Bought by
Bagwell Mark M and Bagwell Wilma
Home Financials for this Owner
Home Financials are based on the most recent Mortgage that was taken out on this home.
Original Mortgage
$231,200
Interest Rate
5.67%
Mortgage Type
New Conventional
Purchase Details
Closed on
Nov 24, 2004
Bought by
Boos Build 5P
Purchase Details
Closed on
Jun 23, 2003
Bought by
Pinnacle
Purchase Details
Closed on
May 30, 2003
Bought by
Pinnacle
Purchase Details
Closed on
Mar 13, 2003
Bought by
B'Ville Muni Dist
Purchase Details
Closed on
May 29, 2001
Bought by
B'Ville Dist 1 68 Pcls
Purchase Details
Closed on
Apr 18, 2001
Bought by
B'Ville Vs Pulaski
Purchase Details
Closed on
Mar 22, 2001
Bought by
Pulaski Bank 11P
Create a Home Valuation Report for This Property
The Home Valuation Report is an in-depth analysis detailing your home's value as well as a comparison with similar homes in the area
Home Values in the Area
Average Home Value in this Area
Purchase History
| Date | Buyer | Sale Price | Title Company |
|---|---|---|---|
| Bagwell Mark M | -- | None Available | |
| Bagwell Mark M | $289,000 | First National Title Company | |
| Boos Build 5P | -- | -- | |
| Boos Build 5P | $243,000 | -- | |
| Pinnacle | -- | -- | |
| Pinnacle | -- | -- | |
| B'Ville Muni Dist | -- | -- | |
| B'Ville Dist 1 68 Pcls | -- | -- | |
| B'Ville Vs Pulaski | -- | -- | |
| Pulaski Bank 11P | -- | -- |
Source: Public Records
Mortgage History
| Date | Status | Borrower | Loan Amount |
|---|---|---|---|
| Previous Owner | Bagwell Mark M | $231,200 |
Source: Public Records
Tax History Compared to Growth
Tax History
| Year | Tax Paid | Tax Assessment Tax Assessment Total Assessment is a certain percentage of the fair market value that is determined by local assessors to be the total taxable value of land and additions on the property. | Land | Improvement |
|---|---|---|---|---|
| 2025 | $4,282 | $110,769 | $19,600 | $91,169 |
| 2024 | $4,302 | $110,769 | $19,600 | $91,169 |
| 2023 | $4,302 | $69,610 | $16,000 | $53,610 |
| 2022 | $4,031 | $69,610 | $16,000 | $53,610 |
| 2021 | $4,000 | $69,610 | $16,000 | $53,610 |
| 2020 | $3,832 | $66,050 | $10,800 | $55,250 |
| 2019 | $3,781 | $66,050 | $10,800 | $55,250 |
| 2018 | $3,633 | $66,050 | $10,800 | $55,250 |
| 2017 | $3,172 | $66,050 | $10,800 | $55,250 |
| 2016 | $3,172 | $66,050 | $10,800 | $55,250 |
| 2015 | $3,359 | $54,360 | $9,000 | $45,360 |
| 2014 | $3,009 | $54,360 | $9,000 | $45,360 |
Source: Public Records
Map
Nearby Homes
- 1303 NE Fairwinds Dr
- 1402 NE Fairwinds Dr
- 3907 NE Cadbury Ave
- Lot 12 Woods Creek Rd
- Lot 14 Woods Creek Rd
- Lot 11 Woods Creek Rd
- Lot 13 Woods Creek Rd
- 4006 NE Cadbury Ave
- 10 Spring Valley Rd
- 4103 NE Kensington Ave
- 501 NE Whitney St
- 1210 Spring St
- 4205 NE Kenton Ave
- 4302 NE Kensington Ave
- 4502 NE Birchgrove Place
- 2001 NE Oak Trail Rd
- 901 NE Mccollum Dr
- 1210 Rice Rd
- 1615 Cresent St
- 1500 Linwood Cir
- 1 Edgewater Ln
- 8 Churchwell Dr
- 6 Churchwell Dr
- 3 Edgewater Ln
- 5 Edgewater Ln
- 6 NE Harbour Dr
- 0 Edgewater Ln
- 4 NE Harbour Dr
- 8 Harbour Dr
- 2 NE Harbour Dr
- 4 Edgewater Ln
- 7 Churchwell Dr
- 2 Edgewater Ln
- 5 Churchwell Dr
- 7 Edgewater Ln
- 2 Churchwell Dr
- 6 Edgewater Ln
- 9 Churchwell Dr
- 3 Churchwell Dr
- 8 Edgewater Ln