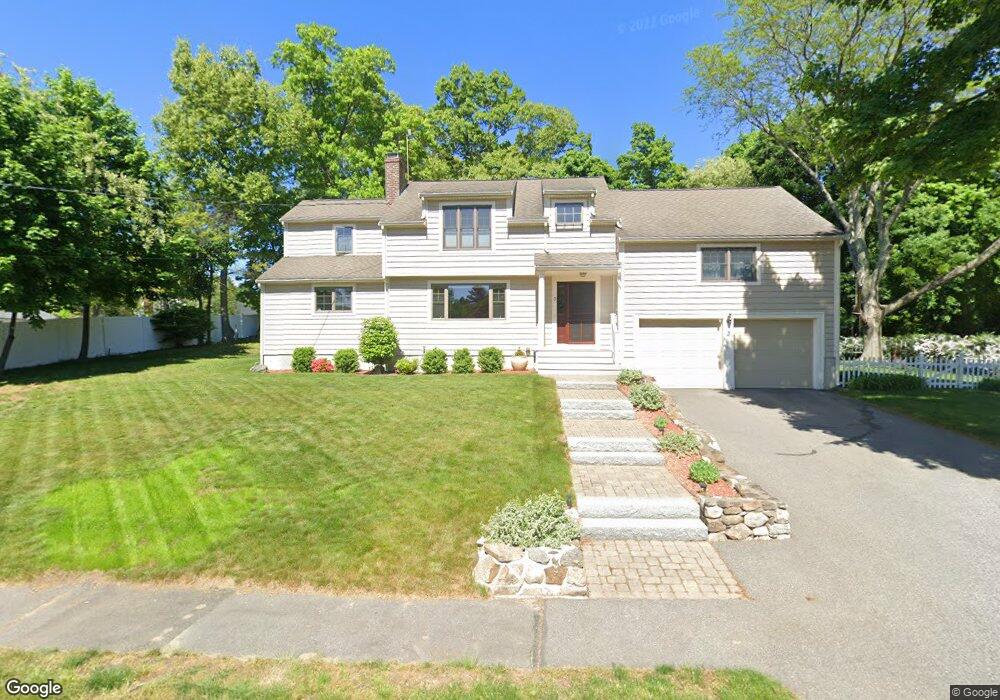
3 Newhall Rd Lynnfield, MA 01940
Estimated Value: $913,000 - $1,091,000
3
Beds
3
Baths
2,684
Sq Ft
$373/Sq Ft
Est. Value
About This Home
This home is located at 3 Newhall Rd, Lynnfield, MA 01940 and is currently estimated at $1,001,027, approximately $372 per square foot. 3 Newhall Rd is a home located in Essex County with nearby schools including Pickering Middle School, Lynnfield High School, and Odyssey Day School.
Ownership History
Date
Name
Owned For
Owner Type
Purchase Details
Closed on
Sep 25, 2009
Sold by
Mealey John J and Mealey Catherine A
Bought by
Mealey John J
Current Estimated Value
Purchase Details
Closed on
May 18, 2001
Sold by
3 Newhall Rd Lynf Rt and Cella Margaret T
Bought by
Mealey John J and Mealey Catherine A
Home Financials for this Owner
Home Financials are based on the most recent Mortgage that was taken out on this home.
Original Mortgage
$268,000
Interest Rate
7.03%
Mortgage Type
Purchase Money Mortgage
Create a Home Valuation Report for This Property
The Home Valuation Report is an in-depth analysis detailing your home's value as well as a comparison with similar homes in the area
Home Values in the Area
Average Home Value in this Area
Purchase History
| Date | Buyer | Sale Price | Title Company |
|---|---|---|---|
| Mealey John J | -- | -- | |
| Mealey John J | $335,000 | -- |
Source: Public Records
Mortgage History
| Date | Status | Borrower | Loan Amount |
|---|---|---|---|
| Closed | Mealey John J | $107,000 | |
| Previous Owner | Mealey John J | $220,000 | |
| Previous Owner | Mealey John J | $268,000 |
Source: Public Records
Tax History Compared to Growth
Tax History
| Year | Tax Paid | Tax Assessment Tax Assessment Total Assessment is a certain percentage of the fair market value that is determined by local assessors to be the total taxable value of land and additions on the property. | Land | Improvement |
|---|---|---|---|---|
| 2025 | $9,100 | $861,700 | $564,100 | $297,600 |
| 2024 | $8,709 | $828,600 | $542,400 | $286,200 |
| 2023 | $9,294 | $822,500 | $514,400 | $308,100 |
| 2022 | $8,981 | $749,000 | $472,400 | $276,600 |
| 2021 | $8,502 | $640,700 | $384,900 | $255,800 |
| 2020 | $8,359 | $600,500 | $344,700 | $255,800 |
| 2019 | $8,353 | $600,500 | $344,700 | $255,800 |
| 2018 | $8,263 | $600,500 | $344,700 | $255,800 |
| 2017 | $8,105 | $588,200 | $332,400 | $255,800 |
| 2016 | $7,579 | $522,700 | $285,200 | $237,500 |
| 2015 | $7,558 | $521,600 | $284,100 | $237,500 |
Source: Public Records
Map
Nearby Homes