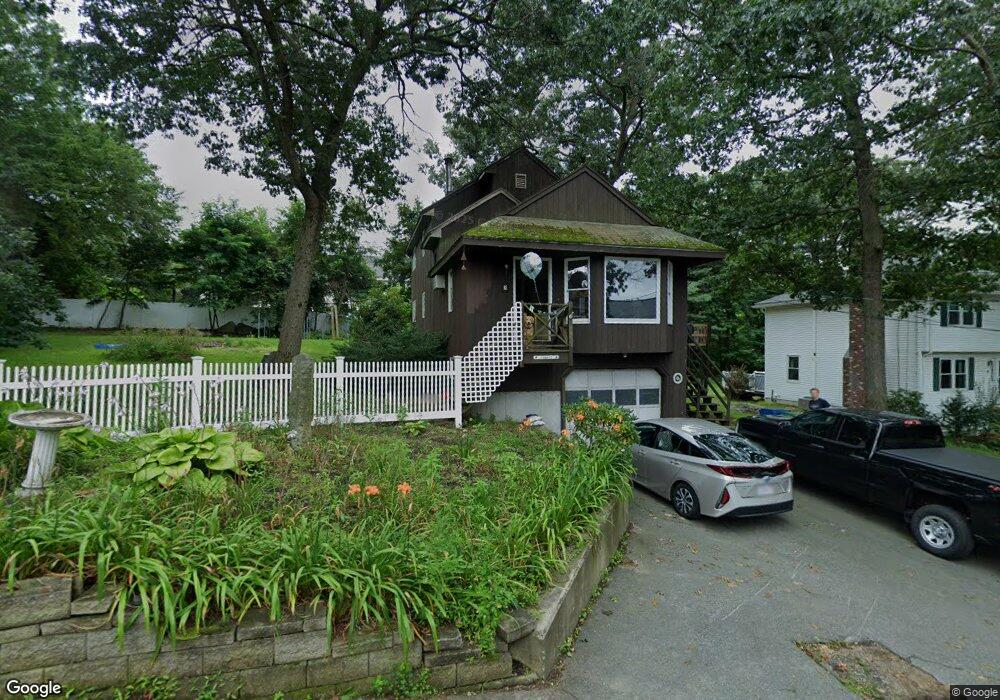
3 Nichold St Burlington, MA 01803
Burlington Town Center NeighborhoodEstimated Value: $621,000 - $964,000
3
Beds
1
Bath
1,557
Sq Ft
$474/Sq Ft
Est. Value
About This Home
This home is located at 3 Nichold St, Burlington, MA 01803 and is currently estimated at $738,668, approximately $474 per square foot. 3 Nichold St is a home located in Middlesex County with nearby schools including Burlington High School, Marshall Simonds Middle School, and Mount Hope Christian School.
Ownership History
Date
Name
Owned For
Owner Type
Purchase Details
Closed on
Oct 8, 2025
Sold by
Spilsbury Brendan W and Wall Sheighla E
Bought by
Ouellet Julianne and Patterson James
Current Estimated Value
Purchase Details
Closed on
Apr 5, 2022
Sold by
Murray Thomas E and Murray Laura R
Bought by
Spilsbury Brendan W and Wall Sheighla
Home Financials for this Owner
Home Financials are based on the most recent Mortgage that was taken out on this home.
Original Mortgage
$498,750
Interest Rate
3.92%
Mortgage Type
Purchase Money Mortgage
Create a Home Valuation Report for This Property
The Home Valuation Report is an in-depth analysis detailing your home's value as well as a comparison with similar homes in the area
Home Values in the Area
Average Home Value in this Area
Purchase History
| Date | Buyer | Sale Price | Title Company |
|---|---|---|---|
| Ouellet Julianne | $700,000 | -- | |
| Spilsbury Brendan W | $525,000 | None Available |
Source: Public Records
Mortgage History
| Date | Status | Borrower | Loan Amount |
|---|---|---|---|
| Previous Owner | Spilsbury Brendan W | $498,750 |
Source: Public Records
Tax History Compared to Growth
Tax History
| Year | Tax Paid | Tax Assessment Tax Assessment Total Assessment is a certain percentage of the fair market value that is determined by local assessors to be the total taxable value of land and additions on the property. | Land | Improvement |
|---|---|---|---|---|
| 2025 | $4,927 | $568,900 | $348,500 | $220,400 |
| 2024 | $4,587 | $513,100 | $318,200 | $194,900 |
| 2023 | $4,386 | $466,600 | $275,800 | $190,800 |
| 2022 | $4,186 | $420,700 | $250,800 | $169,900 |
| 2021 | $4,028 | $404,800 | $234,900 | $169,900 |
| 2020 | $3,866 | $401,000 | $231,100 | $169,900 |
| 2019 | $3,880 | $370,200 | $215,900 | $154,300 |
| 2018 | $3,713 | $349,600 | $209,900 | $139,700 |
| 2017 | $3,656 | $349,600 | $209,900 | $139,700 |
| 2016 | $3,626 | $316,400 | $181,800 | $134,600 |
| 2015 | $3,591 | $316,400 | $181,800 | $134,600 |
| 2014 | $3,498 | $291,500 | $162,100 | $129,400 |
Source: Public Records
Map
Nearby Homes
- 129 Cambridge St Unit 1
- 27 Purity Springs Rd
- 6 Arthur Woods Ave
- 210 Winn St
- 10 Murray Ave Unit 15
- 12 Murray Ave Unit 18
- 5 Shady Lane Dr
- 29 Grove Ln Unit 29
- 50 Hill Cir
- 38 Freeport Dr
- 20 Lantern Ln
- 51 Terrace Hall Ave
- 1 Violet Rd
- 42 Lantern Ln
- 1 Hallmark Gardens Unit 8
- 5 Hallmark Gardens Unit 7
- 3 County Rd
- 9 Woodside Ln
- 11 Violet Rd
- 12 Pleasant St