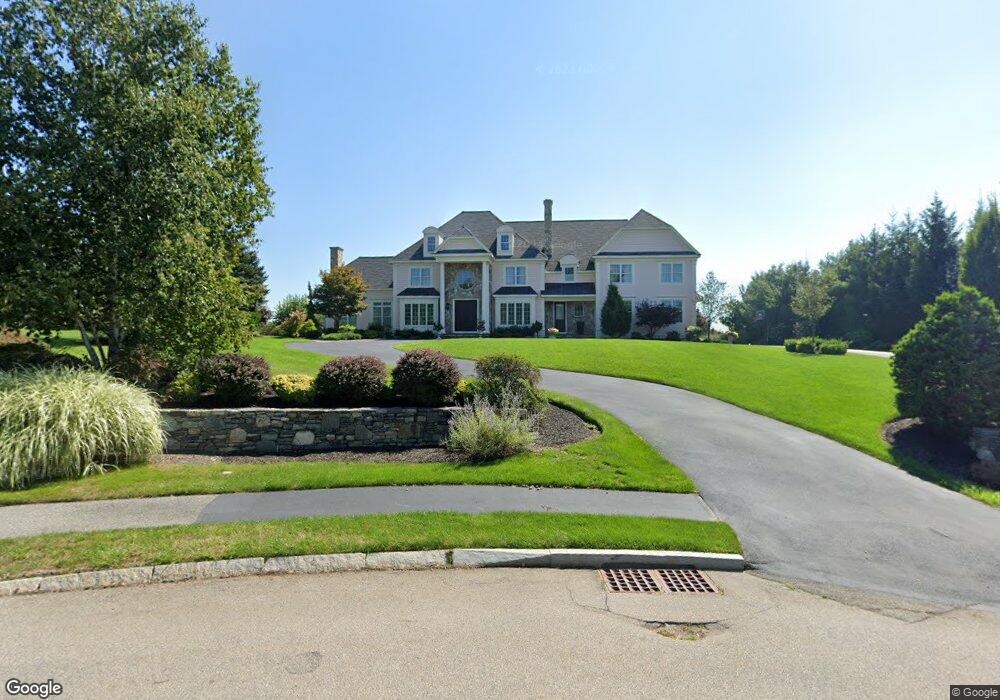
3 Nipmuc Ln Southborough, MA 01772
Estimated Value: $1,990,083 - $2,527,000
5
Beds
4
Baths
4,874
Sq Ft
$461/Sq Ft
Est. Value
About This Home
This home is located at 3 Nipmuc Ln, Southborough, MA 01772 and is currently estimated at $2,246,361, approximately $460 per square foot. 3 Nipmuc Ln is a home located in Worcester County with nearby schools including Mary E Finn School, Albert S. Woodward Memorial School, and Margaret A. Neary School.
Ownership History
Date
Name
Owned For
Owner Type
Purchase Details
Closed on
Mar 11, 2013
Sold by
Fisher Road Rt and Carey
Bought by
Elnesr Mohen M
Current Estimated Value
Home Financials for this Owner
Home Financials are based on the most recent Mortgage that was taken out on this home.
Original Mortgage
$417,000
Outstanding Balance
$291,023
Interest Rate
3.45%
Mortgage Type
Purchase Money Mortgage
Estimated Equity
$1,955,338
Create a Home Valuation Report for This Property
The Home Valuation Report is an in-depth analysis detailing your home's value as well as a comparison with similar homes in the area
Home Values in the Area
Average Home Value in this Area
Purchase History
| Date | Buyer | Sale Price | Title Company |
|---|---|---|---|
| Elnesr Mohen M | $1,374,400 | -- | |
| Elnesr Mohen M | $1,374,400 | -- |
Source: Public Records
Mortgage History
| Date | Status | Borrower | Loan Amount |
|---|---|---|---|
| Open | Elnesr Mohen M | $417,000 | |
| Closed | Elnesr Mohen M | $417,000 |
Source: Public Records
Tax History Compared to Growth
Tax History
| Year | Tax Paid | Tax Assessment Tax Assessment Total Assessment is a certain percentage of the fair market value that is determined by local assessors to be the total taxable value of land and additions on the property. | Land | Improvement |
|---|---|---|---|---|
| 2025 | $26,954 | $1,951,800 | $609,900 | $1,341,900 |
| 2024 | $25,672 | $1,845,600 | $595,200 | $1,250,400 |
| 2023 | $25,039 | $1,696,400 | $580,100 | $1,116,300 |
| 2022 | $23,219 | $1,426,200 | $520,500 | $905,700 |
| 2021 | $21,423 | $1,321,600 | $500,600 | $821,000 |
| 2020 | $22,051 | $1,323,600 | $499,600 | $824,000 |
| 2019 | $20,423 | $1,220,000 | $499,600 | $720,400 |
| 2018 | $20,427 | $1,265,600 | $499,600 | $766,000 |
| 2017 | $19,058 | $1,163,500 | $420,700 | $742,800 |
| 2016 | $20,046 | $1,267,100 | $422,300 | $844,800 |
| 2015 | $21,500 | $1,342,100 | $397,600 | $944,500 |
Source: Public Records
Map
Nearby Homes
- 11 Whispering Brook Rd Unit 55
- lot 1 Sears Rd
- 39 Desimone Dr
- 14 Wolfpen Ln
- Lot 2 Quinn Rd
- 58 Walker St
- 150 Framingham Rd
- 146 Framingham Rd
- 273 W Main St Unit B12
- 14 Lovers Ln
- 15 Lovers Ln
- 3 Madison St
- 8 Saint Mary's Way Unit 8
- 120 Airport Blvd
- 30 Broad St Unit 104
- 2 Adams St
- 102 Liberty St
- 144 Howe St
- 30A Winter Ave
- 87 Neil St