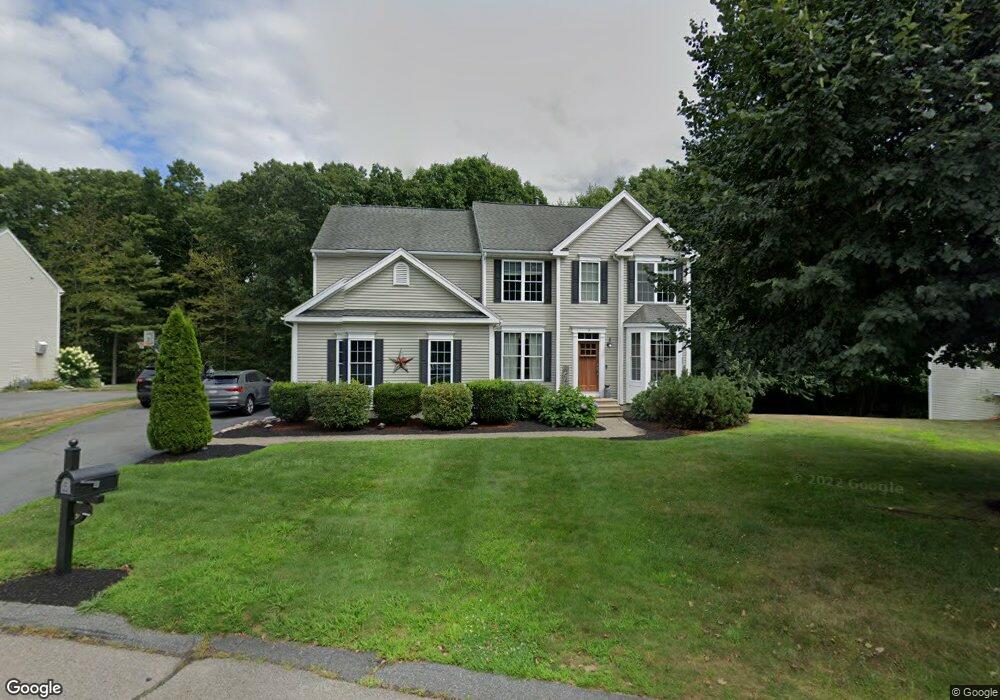
3 Nipmuc Rd South Grafton, MA 01560
Estimated Value: $780,000 - $905,000
4
Beds
3
Baths
2,404
Sq Ft
$350/Sq Ft
Est. Value
About This Home
This home is located at 3 Nipmuc Rd, South Grafton, MA 01560 and is currently estimated at $840,941, approximately $349 per square foot. 3 Nipmuc Rd is a home located in Worcester County with nearby schools including Grafton High School, Touchstone Community School, and Silver Spruce Montessori School.
Ownership History
Date
Name
Owned For
Owner Type
Purchase Details
Closed on
Oct 13, 1999
Sold by
Pulte Home Corp Ne
Bought by
Murphy Brian A and Murphy Alison A
Current Estimated Value
Create a Home Valuation Report for This Property
The Home Valuation Report is an in-depth analysis detailing your home's value as well as a comparison with similar homes in the area
Home Values in the Area
Average Home Value in this Area
Purchase History
| Date | Buyer | Sale Price | Title Company |
|---|---|---|---|
| Murphy Brian A | $269,916 | -- | |
| Murphy Brian A | $269,916 | -- |
Source: Public Records
Mortgage History
| Date | Status | Borrower | Loan Amount |
|---|---|---|---|
| Open | Murphy Brian A | $370,000 | |
| Closed | Murphy Brian A | $350,000 | |
| Closed | Murphy Brian A | $54,000 |
Source: Public Records
Tax History Compared to Growth
Tax History
| Year | Tax Paid | Tax Assessment Tax Assessment Total Assessment is a certain percentage of the fair market value that is determined by local assessors to be the total taxable value of land and additions on the property. | Land | Improvement |
|---|---|---|---|---|
| 2025 | $9,794 | $702,600 | $185,600 | $517,000 |
| 2024 | $9,613 | $671,800 | $176,800 | $495,000 |
| 2023 | $8,868 | $564,500 | $176,800 | $387,700 |
| 2022 | $8,273 | $490,100 | $151,800 | $338,300 |
| 2021 | $8,179 | $476,100 | $137,900 | $338,200 |
| 2020 | $7,806 | $473,100 | $137,900 | $335,200 |
| 2019 | $8,032 | $482,100 | $133,900 | $348,200 |
| 2018 | $7,739 | $466,500 | $133,800 | $332,700 |
| 2017 | $7,549 | $460,300 | $127,600 | $332,700 |
| 2016 | $7,084 | $422,900 | $113,600 | $309,300 |
| 2015 | $6,828 | $413,800 | $107,100 | $306,700 |
| 2014 | $6,467 | $423,800 | $131,800 | $292,000 |
Source: Public Records
Map
Nearby Homes
- 58 Buttercup Ln
- 61 Tulip Cir
- 89 Buttercup Ln Unit 255
- 19 Milford Rd
- 2767 Providence Rd
- 395 Providence Rd Unit 4
- 86 Mikes Way Unit 86
- 84 Mikes Way Unit 84
- 79-81 Upton St
- 150 Sprague St
- 151 Fowler Rd
- 27 Fowler St
- 18 Leland St
- 39 Mechanic St
- 3 Driscoll Ln
- 135 Main St
- 1880 Providence Rd
- 4 Jonathans Way
- 1 Jonathans Way
- 36 Knowlton Cir Unit 36