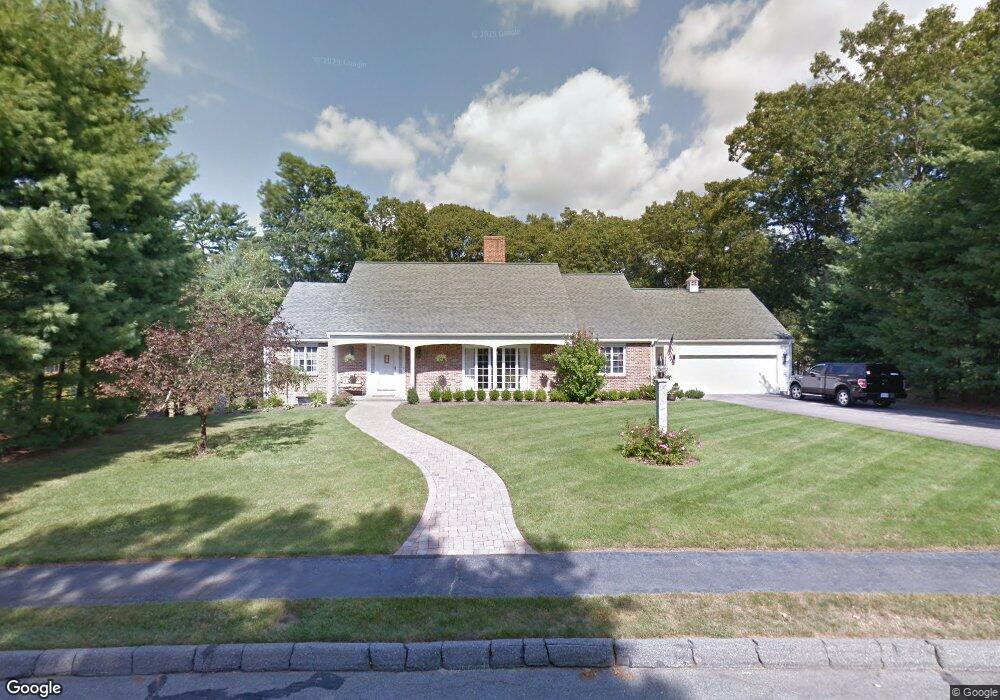
3 Northway Lynnfield, MA 01940
Estimated Value: $1,480,351 - $2,012,000
5
Beds
3
Baths
4,704
Sq Ft
$370/Sq Ft
Est. Value
About This Home
This home is located at 3 Northway, Lynnfield, MA 01940 and is currently estimated at $1,740,338, approximately $369 per square foot. 3 Northway is a home located in Essex County with nearby schools including Pickering Middle School, Lynnfield High School, and Our Lady Of Assumption School.
Ownership History
Date
Name
Owned For
Owner Type
Purchase Details
Closed on
Dec 26, 2014
Sold by
Leach Gary R and Leach Maria R
Bought by
Maria R Leach Ret
Current Estimated Value
Purchase Details
Closed on
Jan 31, 2002
Sold by
Labua Alyce
Bought by
Leach Gary R and Leach Maria R
Create a Home Valuation Report for This Property
The Home Valuation Report is an in-depth analysis detailing your home's value as well as a comparison with similar homes in the area
Home Values in the Area
Average Home Value in this Area
Purchase History
| Date | Buyer | Sale Price | Title Company |
|---|---|---|---|
| Maria R Leach Ret | -- | -- | |
| Maria R Leach Ret | -- | -- | |
| Leach Gary R | $712,500 | -- | |
| Leach Gary R | $712,500 | -- |
Source: Public Records
Mortgage History
| Date | Status | Borrower | Loan Amount |
|---|---|---|---|
| Previous Owner | Leach Gary R | $225,000 | |
| Previous Owner | Leach Gary R | $240,000 | |
| Previous Owner | Leach Gary R | $417,000 |
Source: Public Records
Tax History Compared to Growth
Tax History
| Year | Tax Paid | Tax Assessment Tax Assessment Total Assessment is a certain percentage of the fair market value that is determined by local assessors to be the total taxable value of land and additions on the property. | Land | Improvement |
|---|---|---|---|---|
| 2025 | $13,116 | $1,242,000 | $704,800 | $537,200 |
| 2024 | $12,220 | $1,162,700 | $658,700 | $504,000 |
| 2023 | $12,221 | $1,081,500 | $624,700 | $456,800 |
| 2022 | $12,154 | $1,013,700 | $616,200 | $397,500 |
| 2021 | $11,179 | $842,400 | $467,500 | $374,900 |
| 2020 | $11,149 | $800,900 | $425,000 | $375,900 |
| 2019 | $11,141 | $800,900 | $425,000 | $375,900 |
| 2018 | $11,020 | $800,900 | $425,000 | $375,900 |
| 2017 | $10,948 | $794,500 | $418,600 | $375,900 |
| 2016 | $10,478 | $722,600 | $350,700 | $371,900 |
| 2015 | $10,463 | $722,100 | $350,200 | $371,900 |
Source: Public Records
Map
Nearby Homes