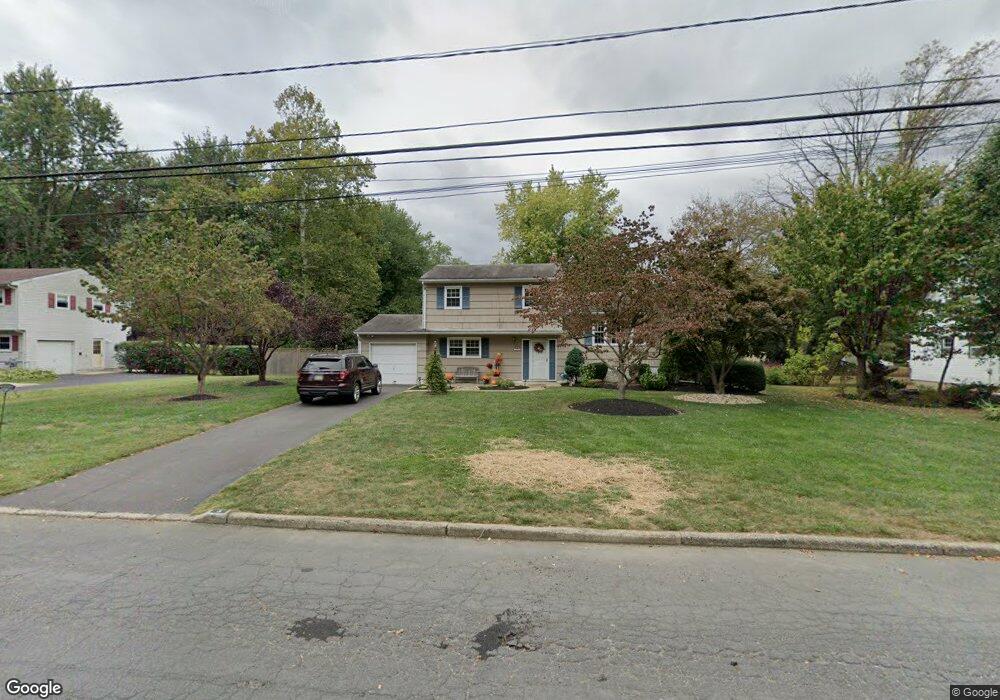
3 Oak Branch Rd East Windsor, NJ 08512
Estimated Value: $584,000 - $602,000
--
Bed
--
Bath
1,514
Sq Ft
$392/Sq Ft
Est. Value
About This Home
This home is located at 3 Oak Branch Rd, East Windsor, NJ 08512 and is currently estimated at $593,237, approximately $391 per square foot. 3 Oak Branch Rd is a home located in Mercer County with nearby schools including Melvin H. Kreps Middle School, Hightstown High School, and SciCore Academy.
Ownership History
Date
Name
Owned For
Owner Type
Purchase Details
Closed on
Nov 16, 2010
Sold by
Meszaros Jeffrey R and Meszaros Ermelinda
Bought by
Meszaros Jeffrey R and Meszaros Ermelinda
Current Estimated Value
Home Financials for this Owner
Home Financials are based on the most recent Mortgage that was taken out on this home.
Original Mortgage
$320,863
Outstanding Balance
$211,485
Interest Rate
4.25%
Mortgage Type
FHA
Estimated Equity
$381,752
Purchase Details
Closed on
Aug 1, 2005
Sold by
Sirva Relocation Llc
Bought by
Meszaros Jeffrey and Gallo Ermelinda
Home Financials for this Owner
Home Financials are based on the most recent Mortgage that was taken out on this home.
Original Mortgage
$316,000
Interest Rate
5.68%
Purchase Details
Closed on
Nov 15, 1995
Sold by
Sincavage Joseph
Bought by
Hinkson Kevin and Hinkson Helen
Home Financials for this Owner
Home Financials are based on the most recent Mortgage that was taken out on this home.
Original Mortgage
$136,000
Interest Rate
7.43%
Create a Home Valuation Report for This Property
The Home Valuation Report is an in-depth analysis detailing your home's value as well as a comparison with similar homes in the area
Home Values in the Area
Average Home Value in this Area
Purchase History
| Date | Buyer | Sale Price | Title Company |
|---|---|---|---|
| Meszaros Jeffrey R | -- | Commonwealth Land Title Insu | |
| Meszaros Jeffrey | $395,000 | -- | |
| Sirva Relocation Llc | $395,000 | -- | |
| Hinkson Kevin | $169,500 | -- |
Source: Public Records
Mortgage History
| Date | Status | Borrower | Loan Amount |
|---|---|---|---|
| Open | Meszaros Jeffrey R | $320,863 | |
| Closed | Sirva Relocation Llc | $316,000 | |
| Previous Owner | Hinkson Kevin | $136,000 |
Source: Public Records
Tax History Compared to Growth
Tax History
| Year | Tax Paid | Tax Assessment Tax Assessment Total Assessment is a certain percentage of the fair market value that is determined by local assessors to be the total taxable value of land and additions on the property. | Land | Improvement |
|---|---|---|---|---|
| 2025 | $9,192 | $247,100 | $150,000 | $97,100 |
| 2024 | $8,703 | $247,100 | $150,000 | $97,100 |
| 2023 | $8,703 | $247,100 | $150,000 | $97,100 |
| 2022 | $8,478 | $247,100 | $150,000 | $97,100 |
| 2021 | $8,416 | $247,100 | $150,000 | $97,100 |
| 2020 | $8,426 | $247,100 | $150,000 | $97,100 |
| 2019 | $8,350 | $247,100 | $150,000 | $97,100 |
| 2018 | $8,241 | $247,100 | $150,000 | $97,100 |
| 2017 | $8,233 | $247,100 | $127,000 | $120,100 |
| 2016 | $8,117 | $247,100 | $127,000 | $120,100 |
| 2015 | $7,959 | $247,100 | $127,100 | $120,000 |
| 2014 | $7,865 | $247,100 | $127,100 | $120,000 |
Source: Public Records
Map
Nearby Homes
- 24 Haymarket Ct
- 41 Haymarket Ct
- 110 S Main St
- 9 Copernicus Ct
- 125 Einstein Way
- 148 Einstein Way
- 4 South Dr
- 5 Trowbridge Ln
- 17 South Dr
- 167 Einstein Way
- 25 Aristotle Way
- 5 Forest Dr
- 1 Sterling Ct
- 132 The Orchard Unit L
- 15 Brownstone Rd
- 86 Labaw Dr
- 4 Sandstone Rd
- 314 Wood Mill Dr
- 0 Route 130
- 116 G the Orchards
- 5 Oak Branch Rd
- 1 Oak Branch Rd
- 22 Rocky Brook Rd
- 7 Oak Branch Rd
- 4 Meadowview Dr
- 6 Meadowview Dr
- 4 Oak Branch Rd
- 16 Rocky Brook Rd
- 2 Meadowview Dr
- 6 Oak Branch Rd
- 8 Meadowview Dr
- 9 Oak Branch Rd
- 21 Rocky Brook Rd
- 14 Rocky Brook Rd
- 19 Rocky Brook Rd
- 8 Oak Branch Rd
- 23 Rocky Brook Rd
- 10 Meadowview Dr
- 17 Rocky Brook Rd
- 11 Oak Branch Rd