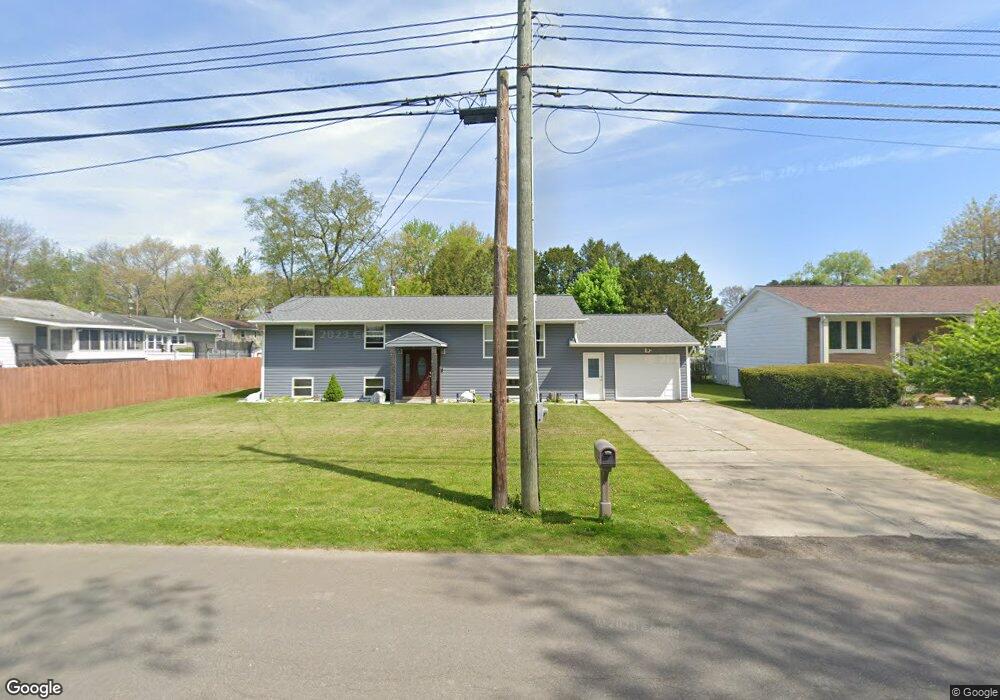
3 Oak Dr Binghamton, NY 13901
Estimated Value: $276,110 - $289,000
4
Beds
2
Baths
2,616
Sq Ft
$108/Sq Ft
Est. Value
About This Home
This home is located at 3 Oak Dr, Binghamton, NY 13901 and is currently estimated at $281,278, approximately $107 per square foot. 3 Oak Dr is a home located in Broome County with nearby schools including Port Dickinson Elementary School, Chenango Bridge Elementary School, and Chenango Valley Middle School.
Ownership History
Date
Name
Owned For
Owner Type
Purchase Details
Closed on
Mar 4, 2022
Sold by
Truxal Michael and Truxal Charolette
Bought by
Truxal Kayla A
Current Estimated Value
Home Financials for this Owner
Home Financials are based on the most recent Mortgage that was taken out on this home.
Original Mortgage
$178,400
Outstanding Balance
$165,973
Interest Rate
3.55%
Mortgage Type
New Conventional
Estimated Equity
$115,305
Purchase Details
Closed on
Apr 23, 2019
Sold by
Zakrajsek Michele M
Bought by
Truxal Michael and Truxal Charolette
Create a Home Valuation Report for This Property
The Home Valuation Report is an in-depth analysis detailing your home's value as well as a comparison with similar homes in the area
Home Values in the Area
Average Home Value in this Area
Purchase History
| Date | Buyer | Sale Price | Title Company |
|---|---|---|---|
| Truxal Kayla A | $237,500 | None Available | |
| Truxal Michael | $91,000 | None Available |
Source: Public Records
Mortgage History
| Date | Status | Borrower | Loan Amount |
|---|---|---|---|
| Open | Truxal Kayla A | $178,400 |
Source: Public Records
Tax History Compared to Growth
Tax History
| Year | Tax Paid | Tax Assessment Tax Assessment Total Assessment is a certain percentage of the fair market value that is determined by local assessors to be the total taxable value of land and additions on the property. | Land | Improvement |
|---|---|---|---|---|
| 2024 | $5,747 | $95,500 | $10,500 | $85,000 |
| 2023 | $5,935 | $95,500 | $10,500 | $85,000 |
| 2022 | $5,744 | $95,500 | $10,500 | $85,000 |
| 2021 | $5,581 | $95,500 | $10,500 | $85,000 |
| 2020 | $5,512 | $95,500 | $10,500 | $85,000 |
| 2019 | -- | $95,500 | $10,500 | $85,000 |
| 2018 | $5,191 | $95,500 | $10,500 | $85,000 |
| 2017 | $2,808 | $95,500 | $10,500 | $85,000 |
| 2016 | $4,283 | $95,500 | $10,500 | $85,000 |
| 2015 | -- | $95,500 | $10,500 | $85,000 |
| 2014 | -- | $95,500 | $10,500 | $85,000 |
Source: Public Records
Map
Nearby Homes