Estimated Value: $538,356 - $735,000
4
Beds
4
Baths
3,252
Sq Ft
$197/Sq Ft
Est. Value
About This Home
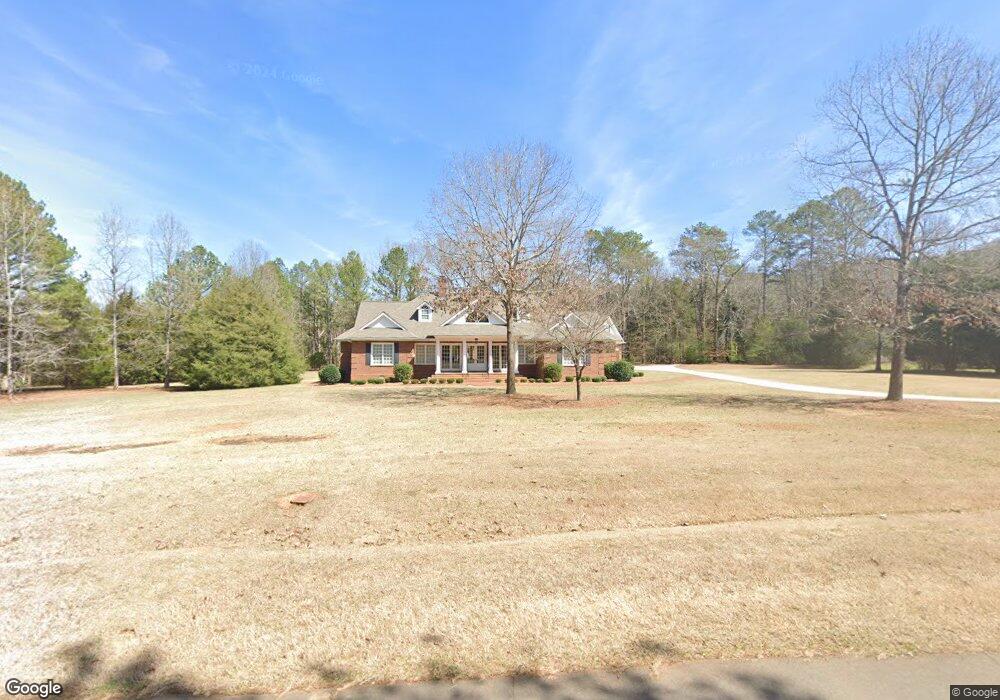
This home is located at 3 Oakmont Dr SW Unit 24, Rome, GA 30161 and is currently estimated at $640,119, approximately $196 per square foot. 3 Oakmont Dr SW Unit 24 is a home located in Floyd County with nearby schools including Pepperell Middle School and Pepperell High School.
Ownership History
Date
Name
Owned For
Owner Type
Purchase Details
Closed on
Sep 12, 2013
Sold by
Earley Dora Mae
Bought by
Mcwhorter G Brian and Mcwhorter Gina B
Current Estimated Value
Home Financials for this Owner
Home Financials are based on the most recent Mortgage that was taken out on this home.
Original Mortgage
$279,920
Outstanding Balance
$208,803
Interest Rate
4.39%
Mortgage Type
New Conventional
Estimated Equity
$431,316
Purchase Details
Closed on
Sep 14, 2010
Sold by
Earley Randy V
Bought by
Earley Johnny Ray
Purchase Details
Closed on
May 4, 2007
Sold by
Not Provided
Bought by
Earley Johnny Ray and Earley Dora Mae
Purchase Details
Closed on
Apr 23, 2007
Sold by
Not Provided
Bought by
Earley Johnny Ray and Earley Dora Mae
Purchase Details
Closed on
Jul 21, 2005
Sold by
Opco Inc
Bought by
Joglekar Samir P and Joglekar Swati
Purchase Details
Closed on
Oct 18, 1993
Bought by
P and R
Purchase Details
Closed on
May 5, 1989
Bought by
Opco Inc
Create a Home Valuation Report for This Property
The Home Valuation Report is an in-depth analysis detailing your home's value as well as a comparison with similar homes in the area
Home Values in the Area
Average Home Value in this Area
Purchase History
| Date | Buyer | Sale Price | Title Company |
|---|---|---|---|
| Mcwhorter G Brian | $349,900 | -- | |
| Earley Johnny Ray | $408,000 | -- | |
| Earley Johnny Ray | $55,000 | -- | |
| Earley Johnny Ray | -- | -- | |
| Joglekar Samir P | $46,000 | -- | |
| P | -- | -- | |
| Opco Inc | -- | -- |
Source: Public Records
Mortgage History
| Date | Status | Borrower | Loan Amount |
|---|---|---|---|
| Open | Mcwhorter G Brian | $279,920 |
Source: Public Records
Tax History Compared to Growth
Tax History
| Year | Tax Paid | Tax Assessment Tax Assessment Total Assessment is a certain percentage of the fair market value that is determined by local assessors to be the total taxable value of land and additions on the property. | Land | Improvement |
|---|---|---|---|---|
| 2024 | $5,176 | $183,774 | $27,300 | $156,474 |
| 2023 | $5,147 | $183,300 | $27,300 | $156,000 |
| 2022 | $5,301 | $182,000 | $26,000 | $156,000 |
| 2021 | $5,393 | $182,000 | $26,000 | $156,000 |
| 2020 | $5,437 | $182,000 | $26,000 | $156,000 |
| 2019 | $5,367 | $182,000 | $26,000 | $156,000 |
| 2018 | $5,376 | $182,000 | $26,000 | $156,000 |
| 2017 | $4,825 | $200,863 | $26,000 | $174,863 |
| 2016 | $5,076 | $169,520 | $26,000 | $143,520 |
| 2015 | -- | $170,960 | $26,000 | $144,960 |
| 2014 | -- | $172,440 | $26,000 | $146,440 |
Source: Public Records
Map
Nearby Homes
- 4365 Cave Spring Rd SW
- 0 Oakmont Dr SW Unit 10648261
- 3667 Cave Spring Rd SW
- 5165 Cave Spring Rd SW
- 0 Blacks Bluff Rd SW Unit 17015073
- 2081 Blacks Bluff Rd SW Unit LOT A
- 2081 Blacks Bluff Lot A Rd SW
- 262 Blacks Bluff Rd SW
- 0 College View Dr SW Unit 10655489
- 0 College View Dr SW Unit 10655483
- 1673 Blacks Bluff Rd SW
- 0 Vanns Valley Rd SW Unit 7589183
- 0 Vanns Valley Rd SW Unit 10534224
- 0 Booger Hollow Rd SW Unit 17969096
- 31 Orchard Spring Dr SW
- 65 Vanns Valley Rd SW
- 849 Booger Hollow Rd SW
- 3241 Horseleg Creek Rd SW
- 4 Rivermont Dr SW
- 0 Chaucer Place SW Unit 7667105
- 3 Oakmont Dr SW
- 5 Oakmont Dr SW
- 4 Oakmont Dr SW
- 7 Oakmont Dr SW
- 5 Saratoga Dr SW
- 4438 Cave Spring Rd SW
- 4455 Cave Spring Rd SW
- 4532 Cave Spring Rd SW
- 6 Oakmont Dr SW
- 6 Oakmont Dr SW
- 6 Oakmont Dr SW
- 8 Oakmont Dr SW
- 0 Saratoga Dr SW Unit 45 8328821
- 0 Saratoga Dr SW Unit 47 8328824
- 0 Saratoga Dr SW Unit 48 8328828
- 0 Saratoga Dr SW Unit 44 8328818
- 0 Saratoga Dr SW Unit 44,45,47,48 8328617
- 0 Saratoga Dr SW Unit 7350224
- 0 Saratoga Dr SW Unit 7350207
- 0 Saratoga Dr SW Unit 7350180