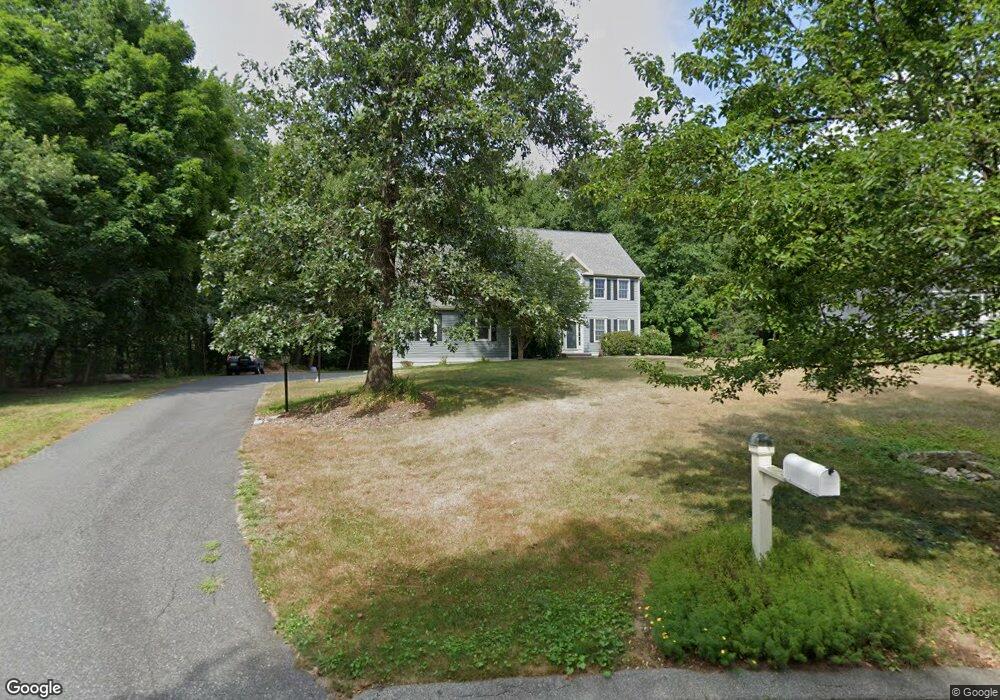
3 Oland Ln Southborough, MA 01772
Estimated Value: $1,117,000 - $1,372,000
4
Beds
3
Baths
2,726
Sq Ft
$451/Sq Ft
Est. Value
About This Home
This home is located at 3 Oland Ln, Southborough, MA 01772 and is currently estimated at $1,228,464, approximately $450 per square foot. 3 Oland Ln is a home located in Worcester County with nearby schools including Margaret A. Neary School, Albert S. Woodward Memorial School, and P. Brent Trottier Middle School.
Ownership History
Date
Name
Owned For
Owner Type
Purchase Details
Closed on
Dec 30, 2024
Sold by
Wong Jack Y and Wong Lisa L
Bought by
3 Oland Lane Rt and Wong
Current Estimated Value
Purchase Details
Closed on
Dec 4, 1998
Sold by
Danforth Dev Corp
Bought by
Wong Jack Y and Wong Lisa L
Home Financials for this Owner
Home Financials are based on the most recent Mortgage that was taken out on this home.
Original Mortgage
$210,000
Interest Rate
6.68%
Mortgage Type
Purchase Money Mortgage
Create a Home Valuation Report for This Property
The Home Valuation Report is an in-depth analysis detailing your home's value as well as a comparison with similar homes in the area
Home Values in the Area
Average Home Value in this Area
Purchase History
| Date | Buyer | Sale Price | Title Company |
|---|---|---|---|
| 3 Oland Lane Rt | -- | None Available | |
| 3 Oland Lane Rt | -- | None Available | |
| Wong Jack Y | $389,900 | -- | |
| Wong Jack Y | $389,900 | -- |
Source: Public Records
Mortgage History
| Date | Status | Borrower | Loan Amount |
|---|---|---|---|
| Previous Owner | Wong Jack Y | $110,200 | |
| Previous Owner | Wong Jack Y | $210,000 |
Source: Public Records
Tax History Compared to Growth
Tax History
| Year | Tax Paid | Tax Assessment Tax Assessment Total Assessment is a certain percentage of the fair market value that is determined by local assessors to be the total taxable value of land and additions on the property. | Land | Improvement |
|---|---|---|---|---|
| 2025 | $14,666 | $1,062,000 | $327,600 | $734,400 |
| 2024 | $13,569 | $975,500 | $317,500 | $658,000 |
| 2023 | $13,036 | $883,200 | $309,700 | $573,500 |
| 2022 | $12,049 | $740,100 | $265,700 | $474,400 |
| 2021 | $12,158 | $750,000 | $287,300 | $462,700 |
| 2020 | $12,157 | $729,700 | $281,900 | $447,800 |
| 2019 | $6,626 | $731,100 | $266,600 | $464,500 |
| 2018 | $11,359 | $703,800 | $256,800 | $447,000 |
| 2017 | $11,222 | $685,100 | $256,800 | $428,300 |
| 2016 | $10,952 | $692,300 | $252,100 | $440,200 |
| 2015 | $10,834 | $676,300 | $237,300 | $439,000 |
Source: Public Records
Map
Nearby Homes
- 19 Gilmore Rd
- 54 Gilmore Rd
- 2 Fairview Dr
- 3 Candlewood Ln
- 11 Skylar Dr
- 7 Rockpoint Rd
- 262 Parkerville Rd
- 35 Lincoln St
- 8 Parker St
- 37 Lincoln St
- 17 Highcroft Way
- 20 Southville Rd
- 9 Highcroft Way Unit 9
- 12 Highcroft Way
- 9 John Matthews Rd
- 20 Clifford Rd
- 19 Washington St
- 2 Aikens Rd
- 23 Stonebrook Ct Unit 11
- 6 Eastbrook Farm Ln