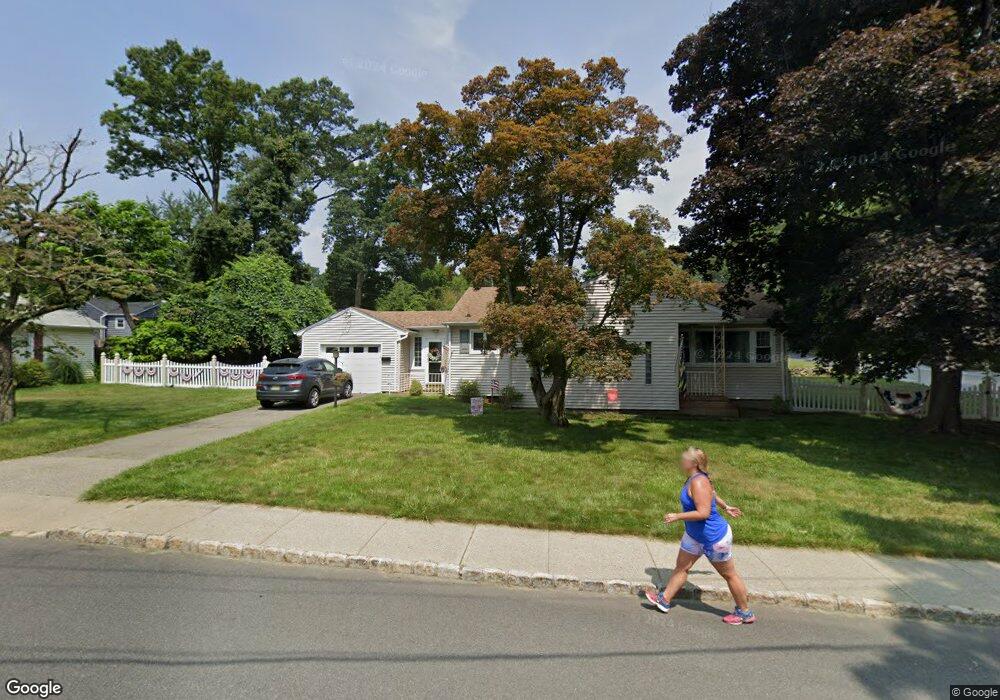
3 Orange St Wharton, NJ 07885
Estimated Value: $445,486 - $574,000
Studio
--
Bath
1,221
Sq Ft
$419/Sq Ft
Est. Value
About This Home
This home is located at 3 Orange St, Wharton, NJ 07885 and is currently estimated at $511,372, approximately $418 per square foot. 3 Orange St is a home located in Morris County with nearby schools including Marie V. Duffy Elementary School and A C Mac Kinnon Middle School.
Ownership History
Date
Name
Owned For
Owner Type
Purchase Details
Closed on
Sep 25, 2000
Sold by
Shupe Margaret L and Shupe Harry R
Bought by
Minell Eugene T and Minell Dawn M
Current Estimated Value
Home Financials for this Owner
Home Financials are based on the most recent Mortgage that was taken out on this home.
Original Mortgage
$164,915
Outstanding Balance
$60,229
Interest Rate
7.94%
Mortgage Type
FHA
Estimated Equity
$451,143
Create a Home Valuation Report for This Property
The Home Valuation Report is an in-depth analysis detailing your home's value as well as a comparison with similar homes in the area
Home Values in the Area
Average Home Value in this Area
Purchase History
| Date | Buyer | Sale Price | Title Company |
|---|---|---|---|
| Minell Eugene T | $165,000 | -- |
Source: Public Records
Mortgage History
| Date | Status | Borrower | Loan Amount |
|---|---|---|---|
| Open | Minell Eugene T | $164,915 |
Source: Public Records
Tax History
| Year | Tax Paid | Tax Assessment Tax Assessment Total Assessment is a certain percentage of the fair market value that is determined by local assessors to be the total taxable value of land and additions on the property. | Land | Improvement |
|---|---|---|---|---|
| 2025 | $9,927 | $358,800 | $131,900 | $226,900 |
| 2024 | $9,383 | $335,500 | $126,900 | $208,600 |
Source: Public Records
Map
Nearby Homes
Your Personal Tour Guide
Ask me questions while you tour the home.