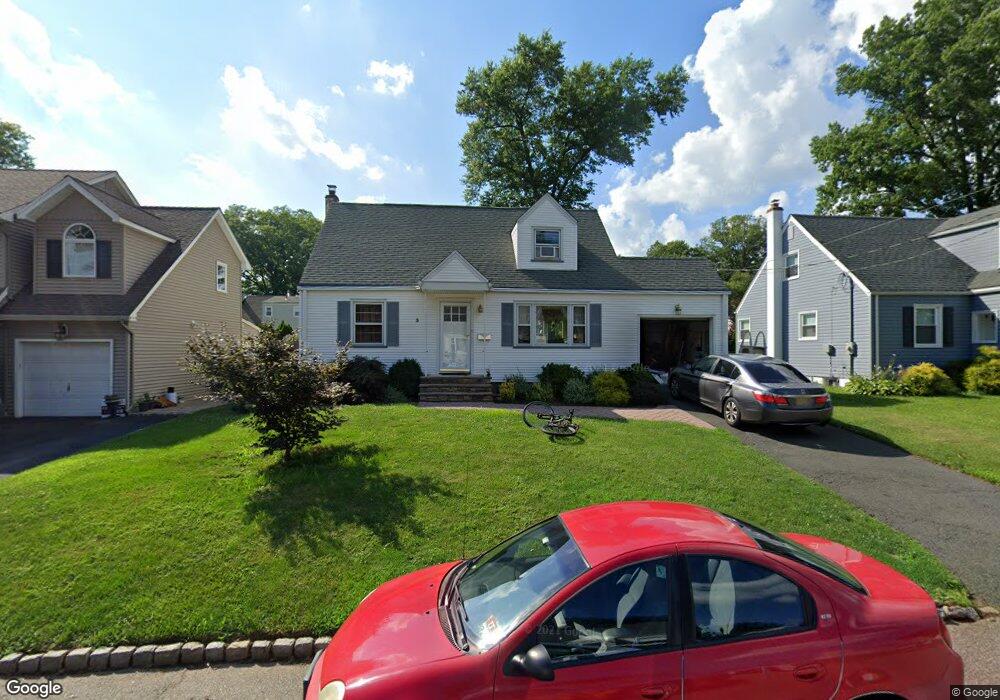
3 Osage Dr Cranford, NJ 07016
Estimated Value: $639,000 - $883,000
--
Bed
--
Bath
840
Sq Ft
$874/Sq Ft
Est. Value
About This Home
This home is located at 3 Osage Dr, Cranford, NJ 07016 and is currently estimated at $734,473, approximately $874 per square foot. 3 Osage Dr is a home located in Union County with nearby schools including Cranford Sr High School, St Michael School, and Mother Seton Regional High School.
Ownership History
Date
Name
Owned For
Owner Type
Purchase Details
Closed on
Feb 10, 2004
Sold by
Swab Charles
Bought by
Risko Christopher and Risko Marygrace
Current Estimated Value
Home Financials for this Owner
Home Financials are based on the most recent Mortgage that was taken out on this home.
Original Mortgage
$85,000
Outstanding Balance
$39,837
Interest Rate
5.82%
Estimated Equity
$694,636
Purchase Details
Closed on
Aug 13, 1999
Sold by
Kryston Marie A
Bought by
Swab Charles S
Home Financials for this Owner
Home Financials are based on the most recent Mortgage that was taken out on this home.
Original Mortgage
$148,000
Interest Rate
7.6%
Create a Home Valuation Report for This Property
The Home Valuation Report is an in-depth analysis detailing your home's value as well as a comparison with similar homes in the area
Home Values in the Area
Average Home Value in this Area
Purchase History
| Date | Buyer | Sale Price | Title Company |
|---|---|---|---|
| Risko Christopher | $299,900 | -- | |
| Swab Charles S | $185,000 | -- |
Source: Public Records
Mortgage History
| Date | Status | Borrower | Loan Amount |
|---|---|---|---|
| Open | Risko Christopher | $85,000 | |
| Previous Owner | Swab Charles S | $148,000 |
Source: Public Records
Tax History Compared to Growth
Tax History
| Year | Tax Paid | Tax Assessment Tax Assessment Total Assessment is a certain percentage of the fair market value that is determined by local assessors to be the total taxable value of land and additions on the property. | Land | Improvement |
|---|---|---|---|---|
| 2025 | $10,833 | $159,800 | $76,300 | $83,500 |
| 2024 | $10,654 | $159,800 | $76,300 | $83,500 |
| 2023 | $10,654 | $159,800 | $76,300 | $83,500 |
| 2022 | $10,566 | $159,800 | $76,300 | $83,500 |
| 2021 | $10,520 | $159,800 | $76,300 | $83,500 |
| 2020 | $10,486 | $159,800 | $76,300 | $83,500 |
| 2019 | $10,419 | $159,800 | $76,300 | $83,500 |
| 2018 | $8,950 | $139,800 | $76,300 | $63,500 |
| 2017 | $8,642 | $139,800 | $76,300 | $63,500 |
| 2016 | $8,328 | $139,800 | $76,300 | $63,500 |
| 2015 | $8,110 | $139,800 | $76,300 | $63,500 |
| 2014 | $7,943 | $134,800 | $76,300 | $58,500 |
Source: Public Records
Map
Nearby Homes