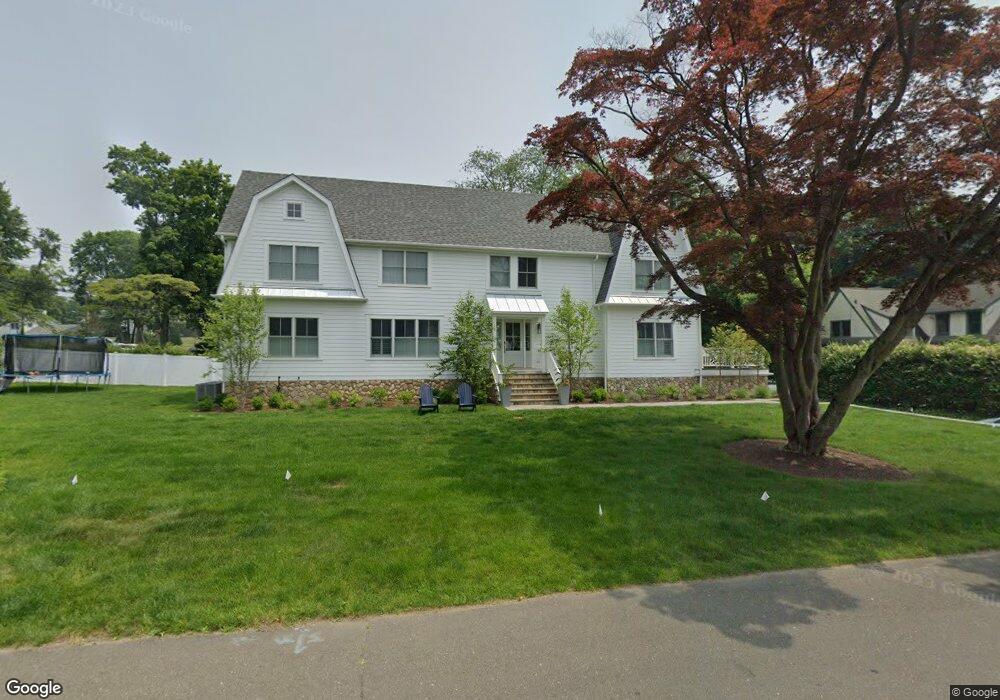
3 Outlook Dr Darien, CT 06820
Estimated Value: $2,643,000 - $3,352,942
3
Beds
5
Baths
1,768
Sq Ft
$1,735/Sq Ft
Est. Value
About This Home
This home is located at 3 Outlook Dr, Darien, CT 06820 and is currently estimated at $3,067,986, approximately $1,735 per square foot. 3 Outlook Dr is a home located in Fairfield County with nearby schools including Hindley Elementary School, Middlesex Middle School, and Darien High School.
Ownership History
Date
Name
Owned For
Owner Type
Purchase Details
Closed on
Jun 21, 2010
Sold by
Deutsche Bank Natl T C
Bought by
Bonanno Theodore J and Bonanno Elizabeth
Current Estimated Value
Home Financials for this Owner
Home Financials are based on the most recent Mortgage that was taken out on this home.
Original Mortgage
$358,300
Interest Rate
5.03%
Purchase Details
Closed on
May 19, 2010
Sold by
Cole Ronald S
Bought by
Deutsche Bank Natl T C
Home Financials for this Owner
Home Financials are based on the most recent Mortgage that was taken out on this home.
Original Mortgage
$358,300
Interest Rate
5.03%
Purchase Details
Closed on
Apr 1, 1998
Sold by
Altschul Charles E and Altschul Wilda R
Bought by
Cole Ronald S
Create a Home Valuation Report for This Property
The Home Valuation Report is an in-depth analysis detailing your home's value as well as a comparison with similar homes in the area
Home Values in the Area
Average Home Value in this Area
Purchase History
| Date | Buyer | Sale Price | Title Company |
|---|---|---|---|
| Bonanno Theodore J | $658,350 | -- | |
| Deutsche Bank Natl T C | -- | -- | |
| Cole Ronald S | $440,000 | -- |
Source: Public Records
Mortgage History
| Date | Status | Borrower | Loan Amount |
|---|---|---|---|
| Open | Cole Ronald S | $349,000 | |
| Closed | Cole Ronald S | $358,300 | |
| Previous Owner | Cole Ronald S | $890,000 |
Source: Public Records
Tax History Compared to Growth
Tax History
| Year | Tax Paid | Tax Assessment Tax Assessment Total Assessment is a certain percentage of the fair market value that is determined by local assessors to be the total taxable value of land and additions on the property. | Land | Improvement |
|---|---|---|---|---|
| 2025 | $25,830 | $1,668,590 | $708,540 | $960,050 |
| 2024 | $24,512 | $1,668,590 | $708,540 | $960,050 |
| 2023 | $25,337 | $1,438,780 | $524,860 | $913,920 |
| 2022 | $10,995 | $638,120 | $524,860 | $113,260 |
| 2021 | $0 | $638,120 | $524,860 | $113,260 |
| 2020 | $2,842 | $638,120 | $524,860 | $113,260 |
| 2019 | $10,510 | $638,120 | $524,860 | $113,260 |
| 2018 | $3,005 | $582,050 | $468,790 | $113,260 |
| 2017 | $9,406 | $582,050 | $468,790 | $113,260 |
| 2016 | $9,179 | $582,050 | $468,790 | $113,260 |
| 2015 | $8,934 | $582,050 | $468,790 | $113,260 |
| 2014 | $8,737 | $582,050 | $468,790 | $113,260 |
Source: Public Records
Map
Nearby Homes
- 53 Noroton Ave
- 77 Maple St
- 47 Hollow Tree Ridge Rd
- 19 Anthony Ln
- 92 Pear Tree Point Rd
- 88 Pear Tree Point Rd
- 5 Shipway Rd
- 105 Houston Terrace
- 166 Hollow Tree Ridge Rd
- 120 Webb Ave
- 16 Houston Terrace Unit 7
- 39 Noroton Ave
- 28 Aquila Rd
- 45 Hecker Ave
- 333 West Ave Unit 3
- 5 Mayflower Rd
- 19 William St
- 16 Neponsit St
- 33 Dora St
- 214 Seaside Ave