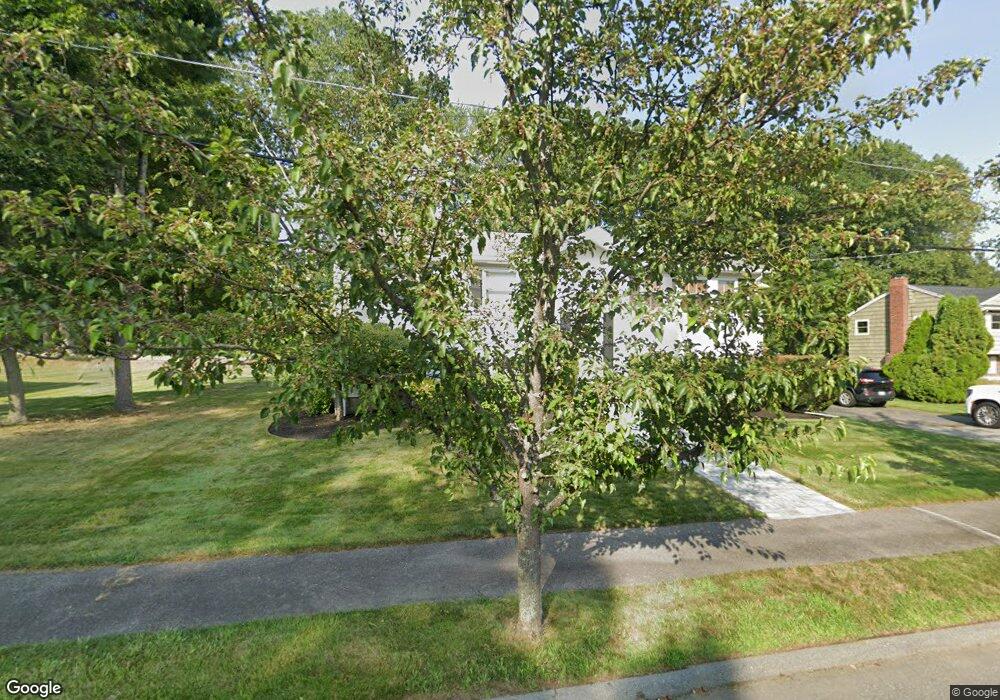
3 Overbrook Rd Middleton, MA 01949
Estimated Value: $709,000 - $808,000
4
Beds
2
Baths
1,144
Sq Ft
$677/Sq Ft
Est. Value
About This Home
This home is located at 3 Overbrook Rd, Middleton, MA 01949 and is currently estimated at $774,345, approximately $676 per square foot. 3 Overbrook Rd is a home located in Essex County with nearby schools including Howe-Manning Elementary School, Fuller Meadow Elementary School, and Masconomet Regional Middle School.
Ownership History
Date
Name
Owned For
Owner Type
Purchase Details
Closed on
Aug 15, 2005
Sold by
Trupasso Anthony and Trupasso Elaine S
Bought by
Porfido Stephen W
Current Estimated Value
Home Financials for this Owner
Home Financials are based on the most recent Mortgage that was taken out on this home.
Original Mortgage
$359,650
Outstanding Balance
$186,284
Interest Rate
5.54%
Mortgage Type
Purchase Money Mortgage
Estimated Equity
$588,061
Create a Home Valuation Report for This Property
The Home Valuation Report is an in-depth analysis detailing your home's value as well as a comparison with similar homes in the area
Home Values in the Area
Average Home Value in this Area
Purchase History
| Date | Buyer | Sale Price | Title Company |
|---|---|---|---|
| Porfido Stephen W | $455,000 | -- | |
| Porfido Stephen W | $455,000 | -- |
Source: Public Records
Mortgage History
| Date | Status | Borrower | Loan Amount |
|---|---|---|---|
| Open | Porfido Stephen W | $359,650 | |
| Closed | Porfido Stephen W | $359,650 |
Source: Public Records
Tax History
| Year | Tax Paid | Tax Assessment Tax Assessment Total Assessment is a certain percentage of the fair market value that is determined by local assessors to be the total taxable value of land and additions on the property. | Land | Improvement |
|---|---|---|---|---|
| 2025 | $8,725 | $733,800 | $398,400 | $335,400 |
| 2024 | $7,679 | $651,300 | $385,900 | $265,400 |
| 2023 | $7,785 | $604,900 | $375,000 | $229,900 |
| 2022 | $6,220 | $469,400 | $277,500 | $191,900 |
| 2021 | $6,594 | $480,600 | $285,000 | $195,600 |
| 2020 | $6,438 | $472,700 | $280,500 | $192,200 |
| 2019 | $6,134 | $448,100 | $257,300 | $190,800 |
| 2018 | $5,682 | $407,000 | $260,300 | $146,700 |
| 2017 | $5,799 | $415,700 | $243,900 | $171,800 |
| 2016 | $5,806 | $418,000 | $243,900 | $174,100 |
| 2015 | $5,516 | $400,300 | $239,400 | $160,900 |
Source: Public Records
Map
Nearby Homes
- 2 Tyler Ln
- 15 Rowell Ln Unit 15
- 1 Mills Point Unit 1
- 6 Cabral Dr
- 20 Bellingham Ct
- 6 White Ln
- 47 Maple St Unit A
- 12 Couture Way
- 1 Couture Way
- 2 Wedge Ct Unit 2
- 14 Niblick Way
- 19 Peachey Cir
- 10 Oak St
- 40 Glen Dr
- 11 James Coffin Way Unit 11
- 69 Forest St
- 78 Essex St
- 220 Swan Pond Rd
- 23 Hamilton Rd
- 35 East St
Your Personal Tour Guide
Ask me questions while you tour the home.