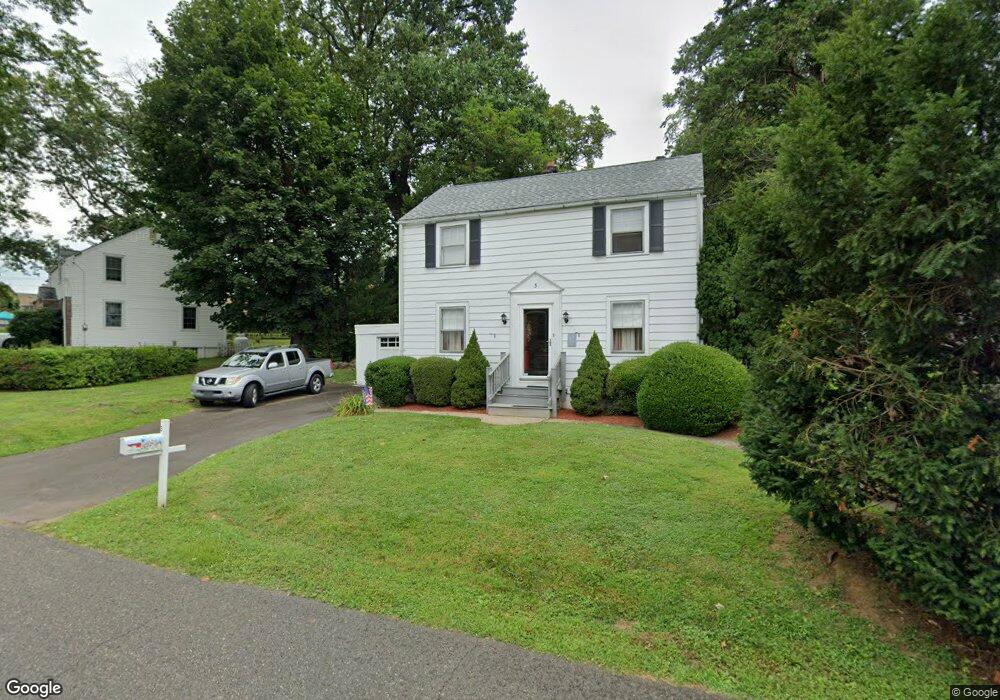
3 Park Ln Feasterville Trevose, PA 19053
Estimated Value: $329,636 - $382,000
3
Beds
1
Bath
1,064
Sq Ft
$328/Sq Ft
Est. Value
About This Home
This home is located at 3 Park Ln, Feasterville Trevose, PA 19053 and is currently estimated at $349,409, approximately $328 per square foot. 3 Park Ln is a home located in Bucks County with nearby schools including Joseph Ferderbar Elementary School, Poquessing Middle School, and Neshaminy High School.
Ownership History
Date
Name
Owned For
Owner Type
Purchase Details
Closed on
Nov 29, 1996
Sold by
Hud
Bought by
Schlupp Timothy K and Schlupp Linda A
Current Estimated Value
Home Financials for this Owner
Home Financials are based on the most recent Mortgage that was taken out on this home.
Original Mortgage
$85,150
Outstanding Balance
$8,757
Interest Rate
7.83%
Mortgage Type
FHA
Estimated Equity
$340,652
Purchase Details
Closed on
Nov 21, 1996
Sold by
Filemyr Marilyn J
Bought by
Hud
Home Financials for this Owner
Home Financials are based on the most recent Mortgage that was taken out on this home.
Original Mortgage
$85,150
Outstanding Balance
$8,757
Interest Rate
7.83%
Mortgage Type
FHA
Estimated Equity
$340,652
Purchase Details
Closed on
Jun 6, 1996
Sold by
Pnc Mtg Corp Of America
Bought by
Hud
Purchase Details
Closed on
Jan 23, 1996
Sold by
Michaels Lawrence R
Bought by
Pnc Mtg Corp Of America
Create a Home Valuation Report for This Property
The Home Valuation Report is an in-depth analysis detailing your home's value as well as a comparison with similar homes in the area
Home Values in the Area
Average Home Value in this Area
Purchase History
| Date | Buyer | Sale Price | Title Company |
|---|---|---|---|
| Schlupp Timothy K | $85,500 | -- | |
| Hud | -- | -- | |
| Hud | -- | -- | |
| Pnc Mtg Corp Of America | $752 | -- |
Source: Public Records
Mortgage History
| Date | Status | Borrower | Loan Amount |
|---|---|---|---|
| Open | Schlupp Timothy K | $85,150 |
Source: Public Records
Tax History Compared to Growth
Tax History
| Year | Tax Paid | Tax Assessment Tax Assessment Total Assessment is a certain percentage of the fair market value that is determined by local assessors to be the total taxable value of land and additions on the property. | Land | Improvement |
|---|---|---|---|---|
| 2025 | $2,808 | $13,200 | $1,160 | $12,040 |
| 2024 | $2,808 | $13,200 | $1,160 | $12,040 |
| 2023 | $2,782 | $13,200 | $1,160 | $12,040 |
| 2022 | $2,708 | $13,200 | $1,160 | $12,040 |
| 2021 | $2,708 | $13,200 | $1,160 | $12,040 |
| 2020 | $2,675 | $13,200 | $1,160 | $12,040 |
| 2019 | $2,614 | $13,200 | $1,160 | $12,040 |
| 2018 | $2,565 | $13,200 | $1,160 | $12,040 |
| 2017 | $2,499 | $13,200 | $1,160 | $12,040 |
| 2016 | $2,499 | $13,200 | $1,160 | $12,040 |
| 2015 | $2,006 | $13,200 | $1,160 | $12,040 |
| 2014 | $2,006 | $13,200 | $1,160 | $12,040 |
Source: Public Records
Map
Nearby Homes