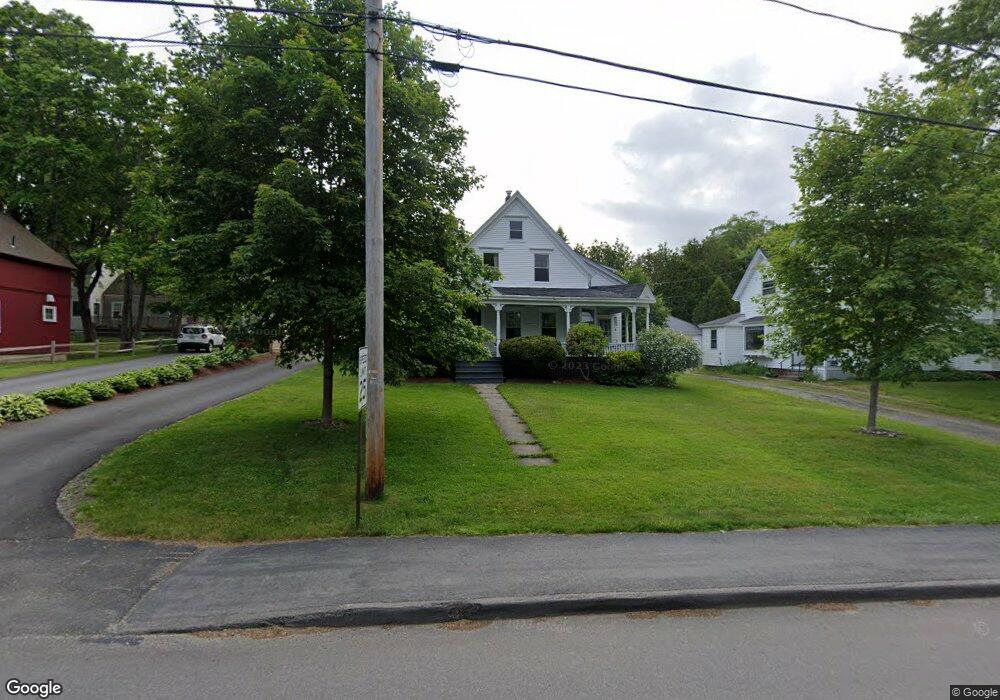
3 Park St Camden, ME 04843
Estimated Value: $626,000 - $671,147
3
Beds
3
Baths
1,791
Sq Ft
$366/Sq Ft
Est. Value
About This Home
This home is located at 3 Park St, Camden, ME 04843 and is currently estimated at $655,787, approximately $366 per square foot. 3 Park St is a home located in Knox County with nearby schools including Camden-Rockport Elementary School, Camden-Rockport Middle School, and Camden Hills Regional High School.
Ownership History
Date
Name
Owned For
Owner Type
Purchase Details
Closed on
Aug 5, 2020
Sold by
Morrison David R and Morrison Susan M
Bought by
S M & David R Morrison Lt and Morrison
Current Estimated Value
Create a Home Valuation Report for This Property
The Home Valuation Report is an in-depth analysis detailing your home's value as well as a comparison with similar homes in the area
Home Values in the Area
Average Home Value in this Area
Purchase History
| Date | Buyer | Sale Price | Title Company |
|---|---|---|---|
| S M & David R Morrison Lt | -- | None Available | |
| S M & David R Morrison Lt | -- | None Available |
Source: Public Records
Tax History Compared to Growth
Tax History
| Year | Tax Paid | Tax Assessment Tax Assessment Total Assessment is a certain percentage of the fair market value that is determined by local assessors to be the total taxable value of land and additions on the property. | Land | Improvement |
|---|---|---|---|---|
| 2024 | $6,028 | $574,100 | $221,600 | $352,500 |
| 2023 | $4,978 | $360,700 | $82,700 | $278,000 |
| 2022 | $4,761 | $360,700 | $82,700 | $278,000 |
| 2021 | $4,533 | $295,300 | $76,000 | $219,300 |
| 2020 | $4,438 | $295,300 | $76,000 | $219,300 |
| 2019 | $4,403 | $295,300 | $76,000 | $219,300 |
| 2018 | $4,659 | $313,100 | $72,400 | $240,700 |
| 2017 | $4,502 | $313,100 | $72,400 | $240,700 |
| 2016 | $4,042 | $259,300 | $70,900 | $188,400 |
| 2015 | $3,923 | $259,300 | $70,900 | $188,400 |
| 2014 | $3,742 | $259,300 | $70,900 | $188,400 |
| 2013 | $3,641 | $259,300 | $70,900 | $188,400 |
Source: Public Records
Map
Nearby Homes