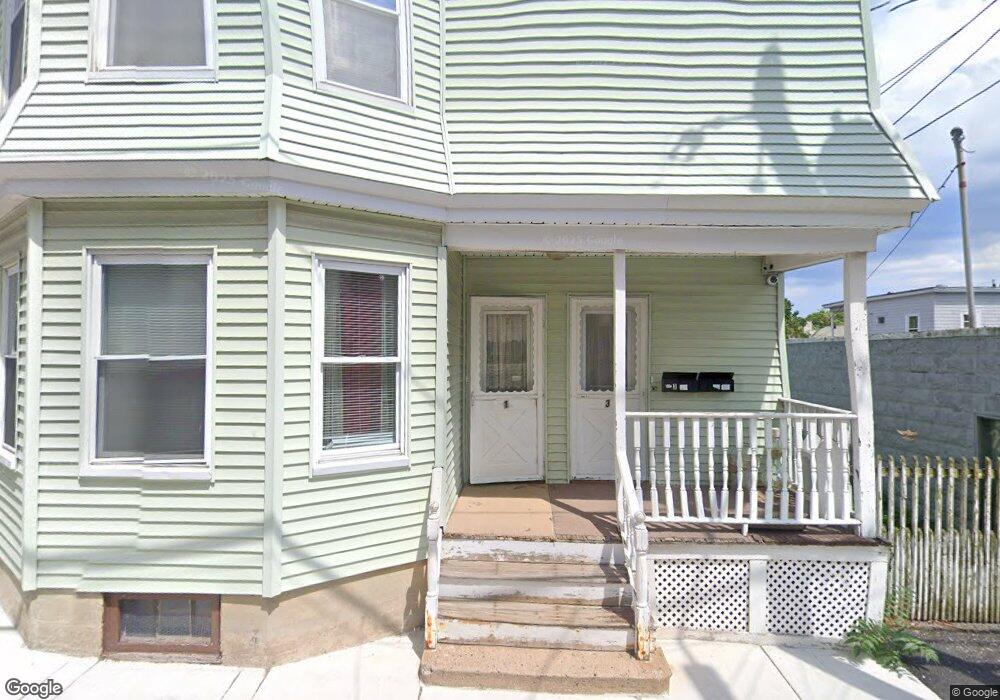
3 Park St Salem, MA 01970
The Point NeighborhoodEstimated Value: $751,503 - $871,000
5
Beds
3
Baths
2,347
Sq Ft
$338/Sq Ft
Est. Value
About This Home
This home is located at 3 Park St, Salem, MA 01970 and is currently estimated at $792,376, approximately $337 per square foot. 3 Park St is a home located in Essex County with nearby schools including Saltonstall School, Carlton Elementary School, and Bates Elementary School.
Ownership History
Date
Name
Owned For
Owner Type
Purchase Details
Closed on
Jun 15, 2018
Sold by
Chi-Ham Alejandra and Swalbach Travis
Bought by
Baltazar Quinner Q
Current Estimated Value
Home Financials for this Owner
Home Financials are based on the most recent Mortgage that was taken out on this home.
Original Mortgage
$444,000
Outstanding Balance
$383,986
Interest Rate
4.5%
Mortgage Type
New Conventional
Estimated Equity
$408,390
Purchase Details
Closed on
Jun 19, 2015
Sold by
Francisco Leocadio and Francisco Anny
Bought by
Swalbach Travis and Chi-Ham Alejandra
Home Financials for this Owner
Home Financials are based on the most recent Mortgage that was taken out on this home.
Original Mortgage
$386,170
Interest Rate
3.87%
Mortgage Type
FHA
Create a Home Valuation Report for This Property
The Home Valuation Report is an in-depth analysis detailing your home's value as well as a comparison with similar homes in the area
Home Values in the Area
Average Home Value in this Area
Purchase History
| Date | Buyer | Sale Price | Title Company |
|---|---|---|---|
| Baltazar Quinner Q | $555,000 | -- | |
| Swalbach Travis | $348,000 | -- |
Source: Public Records
Mortgage History
| Date | Status | Borrower | Loan Amount |
|---|---|---|---|
| Open | Baltazar Quinner Q | $444,000 | |
| Previous Owner | Swalbach Travis | $386,170 |
Source: Public Records
Tax History
| Year | Tax Paid | Tax Assessment Tax Assessment Total Assessment is a certain percentage of the fair market value that is determined by local assessors to be the total taxable value of land and additions on the property. | Land | Improvement |
|---|---|---|---|---|
| 2025 | $7,455 | $657,400 | $143,400 | $514,000 |
| 2024 | $7,203 | $619,900 | $143,400 | $476,500 |
| 2023 | $6,969 | $557,100 | $126,500 | $430,600 |
| 2022 | $6,894 | $520,300 | $118,100 | $402,200 |
| 2021 | $6,525 | $472,800 | $110,200 | $362,600 |
| 2020 | $5,940 | $411,100 | $81,200 | $329,900 |
| 2019 | $5,798 | $384,000 | $71,700 | $312,300 |
| 2018 | $4,762 | $309,600 | $71,700 | $237,900 |
| 2017 | $4,503 | $283,900 | $61,200 | $222,700 |
| 2016 | $3,609 | $230,300 | $61,200 | $169,100 |
| 2015 | $3,054 | $186,100 | $52,600 | $133,500 |
Source: Public Records
Map
Nearby Homes
- 88 Congress St Unit 3
- 185 Lafayette St Unit 3
- 3 Chase St
- 7 Fairfield St
- 86 Wharf St Unit 6
- 59 Leach St Unit 2
- 10.5 Herbert St Unit 21
- 22 Prescott St Unit 1
- 13 Roslyn St Unit 2
- 7 Curtis St Unit 1
- 11 Church St Unit 203
- 11 Church St Unit 702
- 11 Church St Unit 703
- 9 Glover St Unit 1
- 69 Essex St Unit 2
- 6R Hazel Terrace Unit 1
- 131 Derby St Unit 3F
- 11 Summer St
- 10 Hazel St Unit 2
- 289 Essex St Unit 211
Your Personal Tour Guide
Ask me questions while you tour the home.