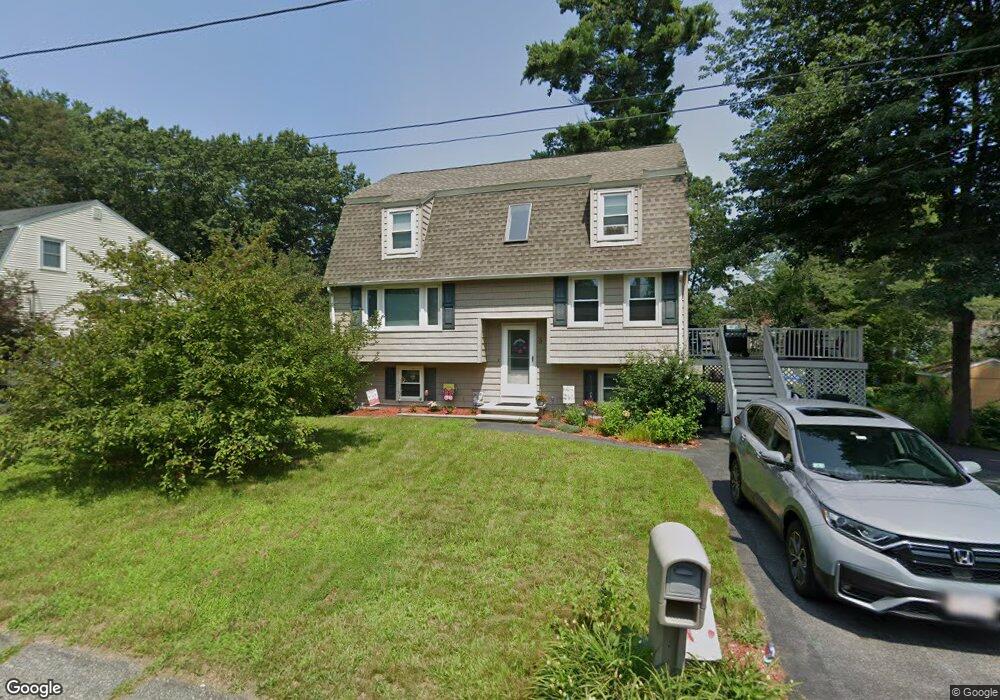
3 Pearl Ct Wilmington, MA 01887
Estimated Value: $679,000 - $787,000
3
Beds
2
Baths
1,756
Sq Ft
$412/Sq Ft
Est. Value
About This Home
This home is located at 3 Pearl Ct, Wilmington, MA 01887 and is currently estimated at $722,738, approximately $411 per square foot. 3 Pearl Ct is a home located in Middlesex County with nearby schools including Heath-Brook Elementary School and Abundant Life Christian School and Childcare.
Ownership History
Date
Name
Owned For
Owner Type
Purchase Details
Closed on
Feb 13, 1990
Sold by
Tighe James D
Bought by
Hill Dana
Current Estimated Value
Home Financials for this Owner
Home Financials are based on the most recent Mortgage that was taken out on this home.
Original Mortgage
$149,900
Interest Rate
9.64%
Mortgage Type
Purchase Money Mortgage
Purchase Details
Closed on
Apr 25, 1989
Sold by
Tighe James
Bought by
Robert Richard
Create a Home Valuation Report for This Property
The Home Valuation Report is an in-depth analysis detailing your home's value as well as a comparison with similar homes in the area
Home Values in the Area
Average Home Value in this Area
Purchase History
| Date | Buyer | Sale Price | Title Company |
|---|---|---|---|
| Robert Richard | $171,500 | -- | |
| Hill Dana | $149,900 | -- |
Source: Public Records
Mortgage History
| Date | Status | Borrower | Loan Amount |
|---|---|---|---|
| Open | Robert Richard | $80,000 | |
| Closed | Robert Richard | $100,000 | |
| Closed | Robert Richard | $118,000 | |
| Closed | Robert Richard | $149,900 |
Source: Public Records
Tax History Compared to Growth
Tax History
| Year | Tax Paid | Tax Assessment Tax Assessment Total Assessment is a certain percentage of the fair market value that is determined by local assessors to be the total taxable value of land and additions on the property. | Land | Improvement |
|---|---|---|---|---|
| 2025 | $7,228 | $631,300 | $272,500 | $358,800 |
| 2024 | $6,932 | $606,500 | $272,500 | $334,000 |
| 2023 | $6,689 | $560,200 | $247,700 | $312,500 |
| 2022 | $6,352 | $487,500 | $206,400 | $281,100 |
| 2021 | $6,314 | $456,200 | $187,600 | $268,600 |
| 2020 | $6,309 | $464,600 | $187,600 | $277,000 |
| 2019 | $5,852 | $425,600 | $178,700 | $246,900 |
| 2018 | $5,682 | $394,300 | $170,200 | $224,100 |
| 2017 | $5,708 | $395,000 | $162,100 | $232,900 |
| 2016 | $5,333 | $364,500 | $154,400 | $210,100 |
| 2015 | $4,936 | $343,500 | $154,400 | $189,100 |
| 2014 | $4,585 | $322,000 | $147,000 | $175,000 |
Source: Public Records
Map
Nearby Homes